Technical Analysis of ZTO 2024-05-10
Overview:
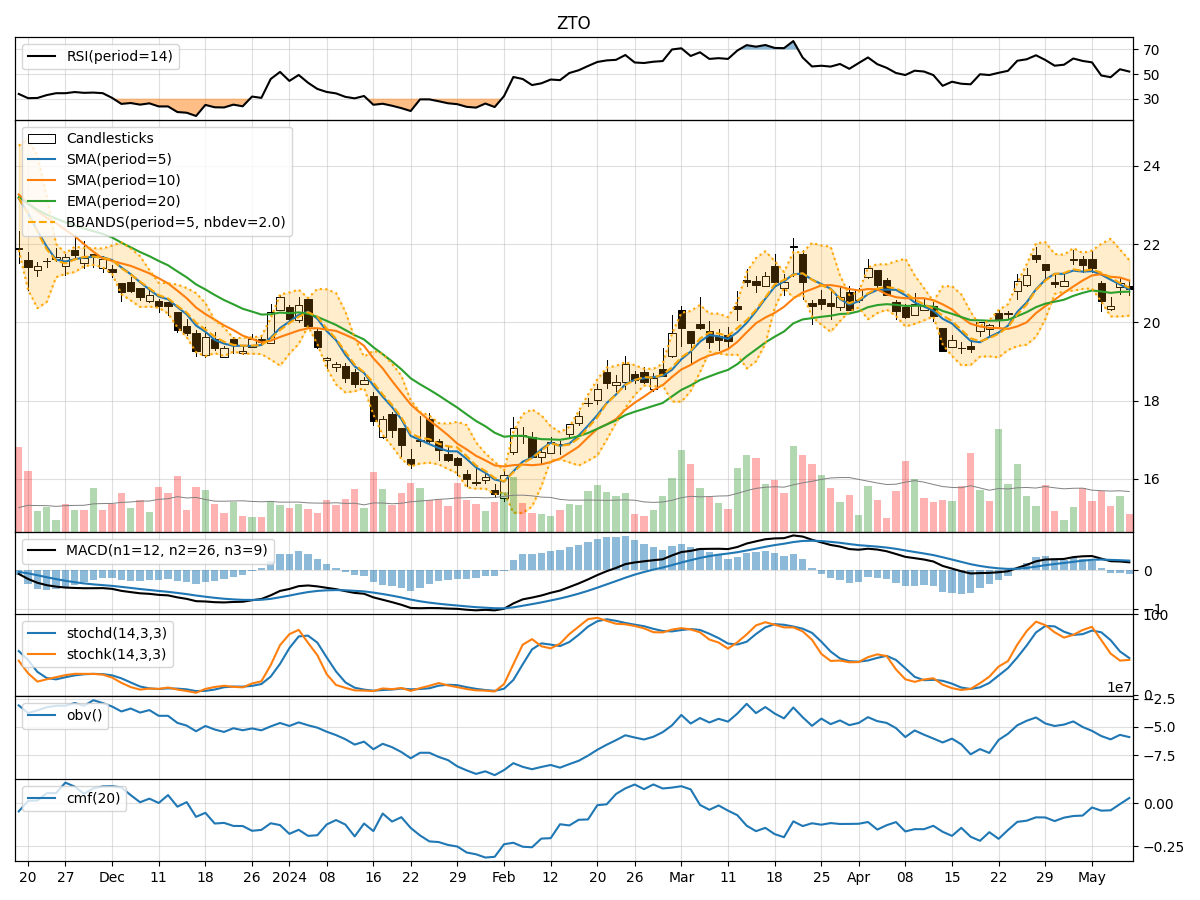
In analyzing the technical indicators for ZTO stock over the last 5 days, we will delve into the trend, momentum, volatility, and volume indicators to provide a comprehensive outlook on the possible future stock price movement. By examining these key aspects, we aim to offer valuable insights and recommendations for potential investors.
Trend Indicators:
- Moving Averages (MA): The 5-day Moving Average (MA) has been fluctuating around the closing prices, indicating short-term price trends. The Simple Moving Average (SMA) and Exponential Moving Average (EMA) show a slight upward trend, albeit with some volatility.
- MACD: The Moving Average Convergence Divergence (MACD) and its signal line (MACDH) have been hovering around the zero line, suggesting a lack of clear trend direction.
Momentum Indicators:
- RSI: The Relative Strength Index (RSI) has been oscillating around the mid-level, indicating a balanced momentum between buying and selling pressure.
- Stochastic Oscillator: Both %K and %D lines of the Stochastic Oscillator are in the oversold region, suggesting a potential reversal in price direction.
- Williams %R: The Williams %R is in the oversold territory, indicating a possible buying opportunity.
Volatility Indicators:
- Bollinger Bands (BB): The Bollinger Bands are narrowing, indicating decreasing volatility and a potential breakout in price.
- Bollinger %B: The %B indicator is hovering around the middle range, suggesting a neutral stance in terms of volatility.
Volume Indicators:
- On-Balance Volume (OBV): The OBV has been fluctuating, indicating mixed buying and selling pressure.
- Chaikin Money Flow (CMF): The CMF is negative, signaling a slight outflow of money from the stock.
Key Observations:
- The trend indicators show a lack of clear direction, with moving averages and MACD signaling potential consolidation.
- Momentum indicators suggest a possible reversal in price direction due to oversold conditions.
- Volatility indicators point towards decreasing volatility and a potential breakout.
- Volume indicators reflect mixed sentiment, with no strong accumulation or distribution signals.
Conclusion:
Based on the analysis of the technical indicators, the next few days for ZTO stock could see sideways movement with a slight bullish bias. Traders should watch for a potential breakout as volatility decreases, while also considering the oversold conditions in momentum indicators for a possible reversal. It is essential to monitor price action closely and consider additional fundamental factors before making any investment decisions.