Technical Analysis of ZH 2024-05-10
Overview:
In analyzing the technical indicators for ZH stock over the last 5 days, we will delve into the trend, momentum, volatility, and volume indicators to provide a comprehensive outlook on the possible future stock price movement. By examining these key indicators, we aim to offer valuable insights and predictions for the upcoming trading days.
Trend Analysis:
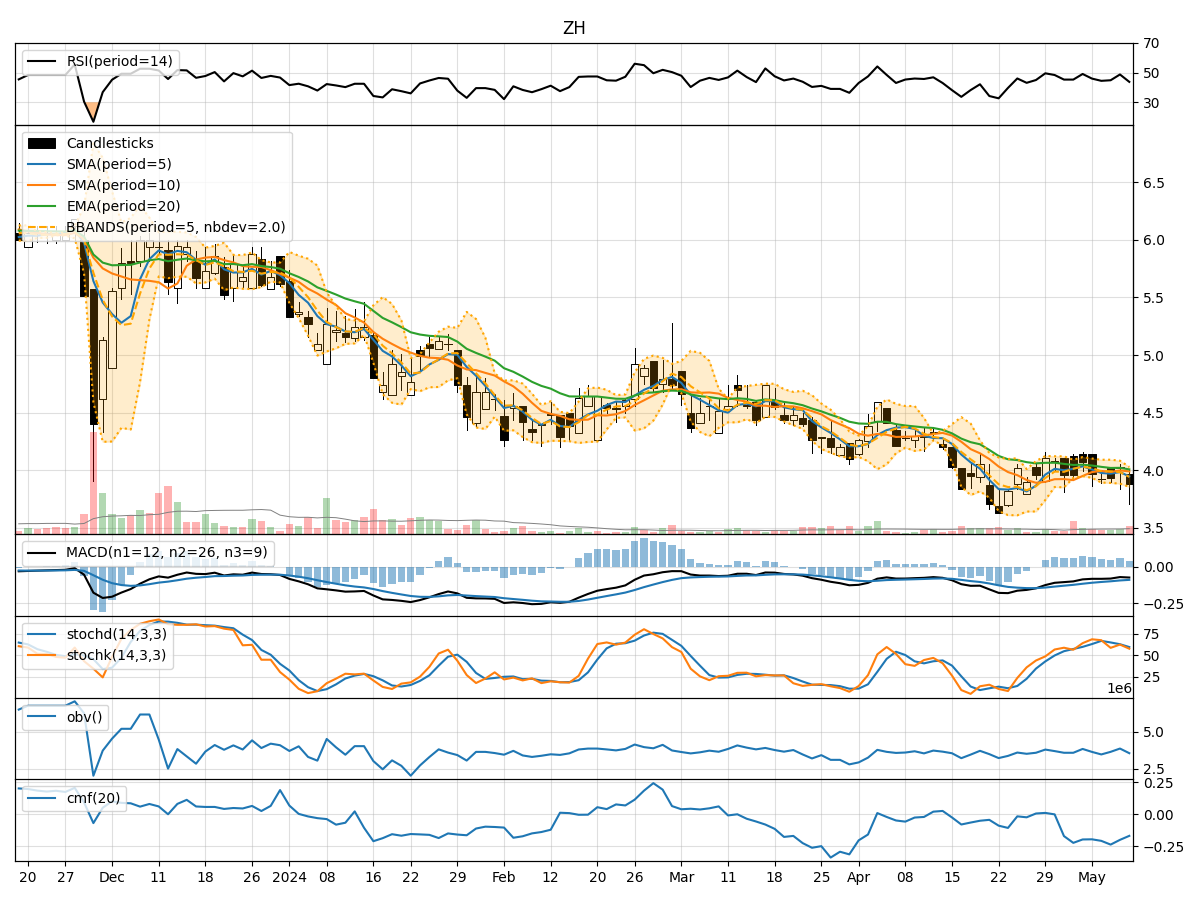
- Moving Averages (MA): The 5-day MA has been fluctuating around the closing prices, indicating short-term price trends. The SMA(10) and EMA(20) show a slight downward trend, suggesting a potential bearish sentiment in the medium to long term.
- MACD and Signal Line: The MACD line has been consistently below the signal line, reflecting a bearish momentum in the stock price.
- MACD Histogram: The MACD histogram has been decreasing, indicating a weakening bearish momentum.
Momentum Analysis:
- RSI (14): The RSI has been hovering around the 50 level, suggesting a neutral momentum in the stock.
- Stochastic Oscillator: Both %K and %D lines of the stochastic oscillator have been declining, indicating a bearish momentum.
- Williams %R: The Williams %R is in the oversold territory, signaling a potential reversal or bounce in the stock price.
Volatility Analysis:
- Bollinger Bands: The stock price has been trading within the Bollinger Bands, with the bands narrowing, indicating decreasing volatility.
- Bollinger %B: The %B indicator is below 0.2, suggesting the stock is oversold and may see a potential reversal.
Volume Analysis:
- On-Balance Volume (OBV): The OBV has been fluctuating, indicating indecision among investors regarding the stock.
- Chaikin Money Flow (CMF): The CMF has been negative, suggesting outflow of money from the stock.
Key Observations:
- The trend indicators show a bearish sentiment in the medium to long term.
- Momentum indicators suggest a bearish momentum in the stock price.
- Volatility indicators point towards decreasing volatility in the stock.
- Volume indicators reflect indecision and potential outflow of money from the stock.
Conclusion:
Based on the analysis of the technical indicators, the stock price of ZH is likely to continue its downward movement in the next few days. The bearish trend, momentum, and oversold conditions indicated by various indicators suggest a potential further decline in the stock price. Traders and investors should exercise caution and consider shorting or staying away from long positions until a clear reversal pattern emerges.