Technical Analysis of ZBH 2024-05-10
Overview:
In analyzing the technical indicators for ZBH over the last 5 days, we will delve into the trend, momentum, volatility, and volume indicators to provide a comprehensive outlook on the possible stock price movement. By examining these key factors, we aim to offer valuable insights and predictions for the upcoming days.
Trend Analysis:
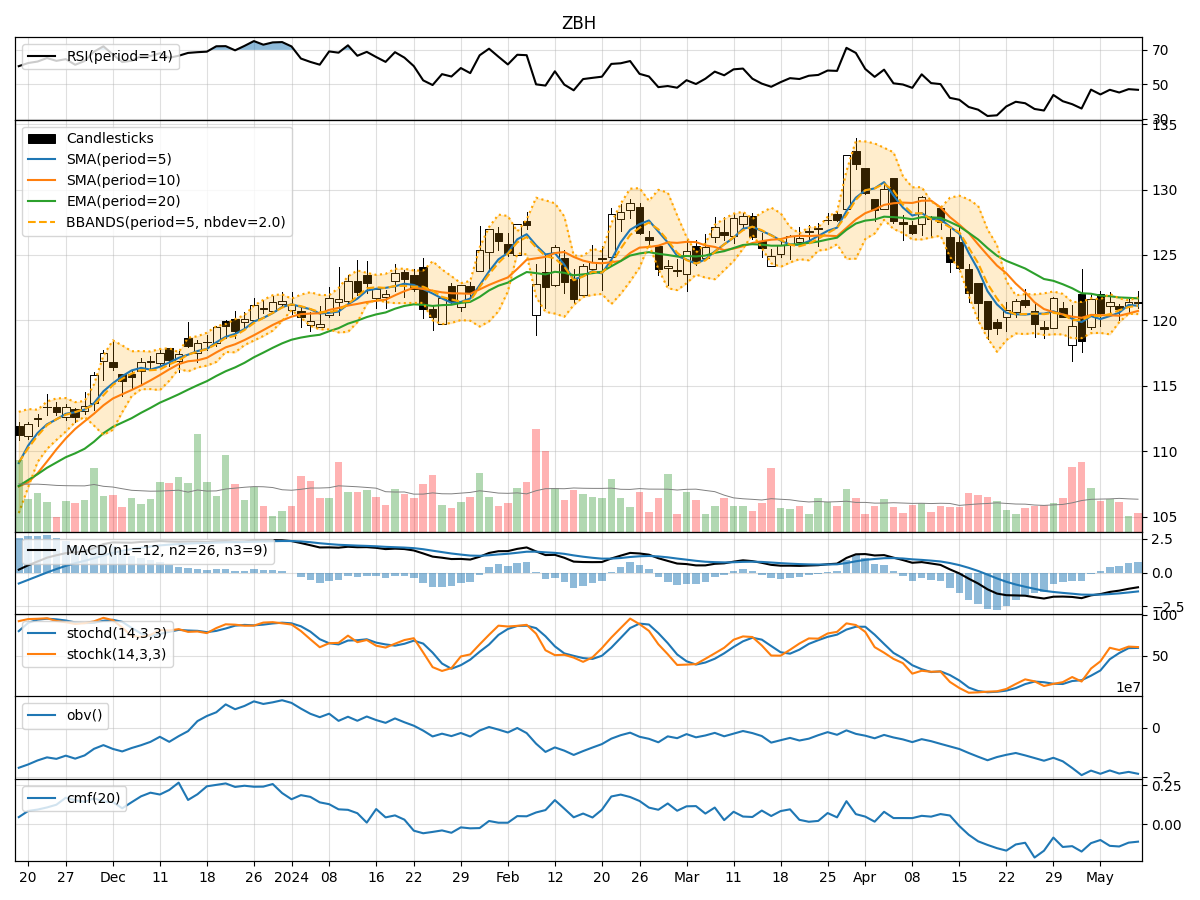
- Moving Averages (MA): The 5-day Moving Average (MA) has been fluctuating around the closing prices, indicating short-term price trends. The Simple Moving Average (SMA) and Exponential Moving Average (EMA) show a slight downward trend, suggesting a potential bearish sentiment.
- MACD: The Moving Average Convergence Divergence (MACD) has been negative, with the MACD line below the signal line. This indicates a bearish momentum in the stock price.
- Conclusion: The trend indicators point towards a bearish outlook for ZBH in the near term.
Momentum Analysis:
- RSI: The Relative Strength Index (RSI) has been hovering around the mid-range, indicating a neutral momentum in the stock.
- Stochastic Oscillator: Both %K and %D lines of the Stochastic Oscillator have been in the overbought territory, suggesting a potential reversal in the price trend.
- Williams %R: The Williams %R is also in the oversold region, indicating a possible bullish reversal.
- Conclusion: The momentum indicators show a mixed signal, with a slight bias towards a bullish reversal.
Volatility Analysis:
- Bollinger Bands: The Bollinger Bands have been narrowing, indicating decreasing volatility in the stock price. The bands are relatively close to the moving average, suggesting a period of consolidation.
- Conclusion: The volatility indicators suggest a consolidation phase for ZBH, with a potential breakout in either direction.
Volume Analysis:
- On-Balance Volume (OBV): The OBV has been fluctuating, indicating indecision among investors regarding the stock.
- Chaikin Money Flow (CMF): The CMF has been negative, reflecting selling pressure in the stock.
- Conclusion: The volume indicators point towards a neutral stance, with no clear direction in investor sentiment.
Overall Conclusion:
Based on the analysis of trend, momentum, volatility, and volume indicators, the overall outlook for ZBH in the next few days is as follows: - Trend: Bearish - Momentum: Mixed with a slight bullish bias - Volatility: Consolidation - Volume: Neutral
Final Recommendation:
Considering the comprehensive analysis of technical indicators, it is recommended to exercise caution when trading ZBH in the upcoming days. Traders should closely monitor key levels and wait for a clearer signal before taking significant positions. The stock is likely to experience sideways movement with a potential for a bullish reversal based on momentum indicators. However, the overall trend remains bearish, indicating a challenging trading environment.