Technical Analysis of YUMC 2024-05-10
Overview:
In analyzing the technical indicators for YUMC over the last 5 days, we will delve into the trends, momentum, volatility, and volume aspects to provide a comprehensive outlook on the possible stock price movement. By examining these key indicators, we aim to offer valuable insights and predictions for the upcoming days.
Trend Analysis:
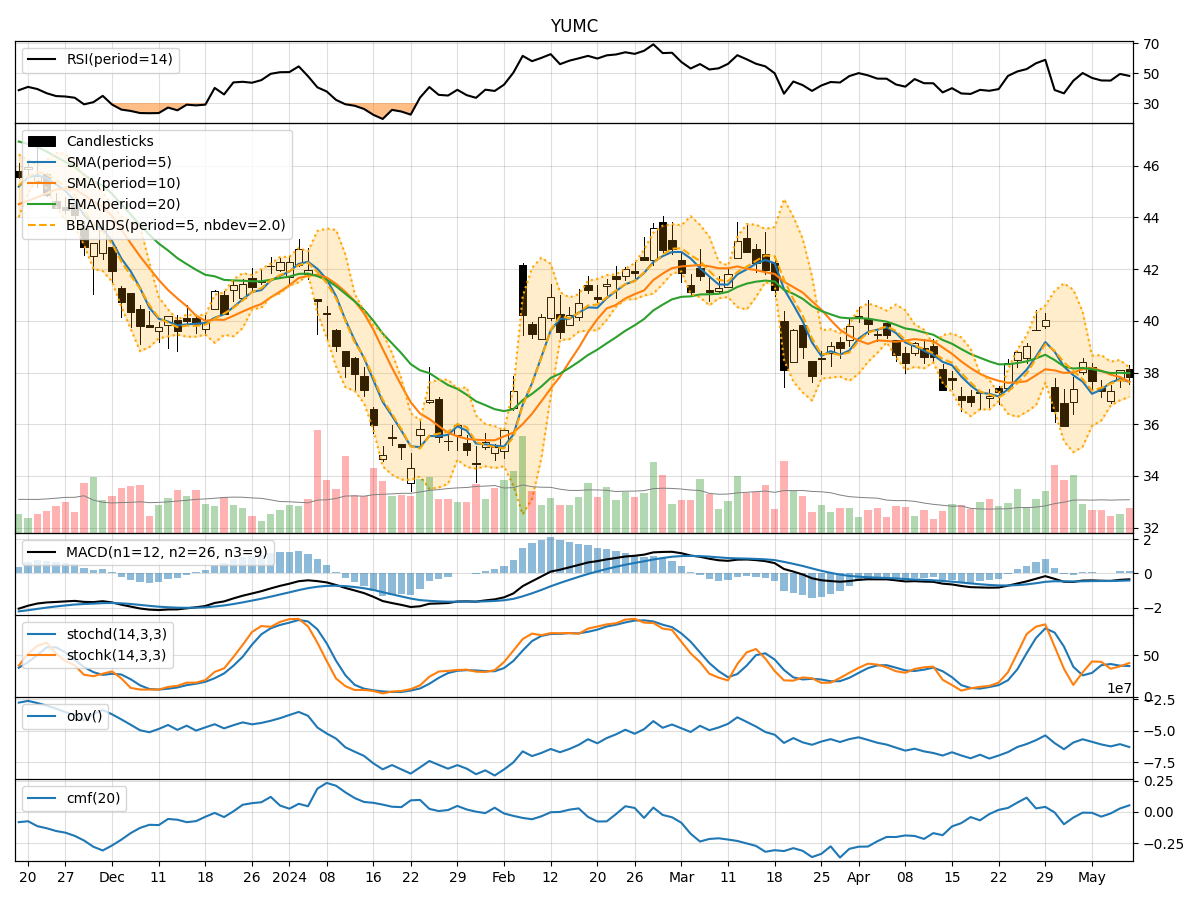
- Moving Averages (MA): The 5-day Moving Average (MA) has been fluctuating around the closing prices, indicating a short-term trend. The Simple Moving Average (SMA) and Exponential Moving Average (EMA) show a downward trend, with the EMA slightly below the SMA.
- Moving Average Convergence Divergence (MACD): The MACD line has been negative, suggesting a bearish trend. However, the MACD Histogram is showing signs of convergence, hinting at a possible trend reversal.
Momentum Analysis:
- Relative Strength Index (RSI): The RSI values have been hovering around the mid-range, indicating a neutral momentum in the stock.
- Stochastic Oscillator: Both %K and %D values of the Stochastic Oscillator are below 50, suggesting a bearish momentum.
- Williams %R (Willams %R): The Williams %R is also in the oversold territory, indicating a potential reversal or consolidation.
Volatility Analysis:
- Bollinger Bands (BB): The Bollinger Bands have been narrowing, indicating decreasing volatility. The current price is within the bands, suggesting a period of consolidation.
- Bollinger Band %B (BB %B): The %B value is close to 0.5, indicating a balanced market sentiment.
Volume Analysis:
- On-Balance Volume (OBV): The OBV has shown mixed movements, reflecting indecision among market participants.
- Chaikin Money Flow (CMF): The CMF has been negative, indicating selling pressure in the stock.
Conclusion:
Based on the analysis of the technical indicators, the stock of YUMC is currently exhibiting a bearish bias in the short term. The trend indicators suggest a potential reversal in the near future, while momentum indicators point towards a bearish sentiment. Volatility is decreasing, indicating a period of consolidation, and volume indicators reflect mixed market participation.
Forecast:
Considering the overall technical picture, it is likely that YUMC may experience further downside pressure in the coming days. Traders should exercise caution and consider waiting for more definitive signals before making any significant trading decisions. It is advisable to closely monitor key support levels and watch for any potential trend reversals or breakout opportunities.