Technical Analysis of YUM 2024-05-10
Overview:
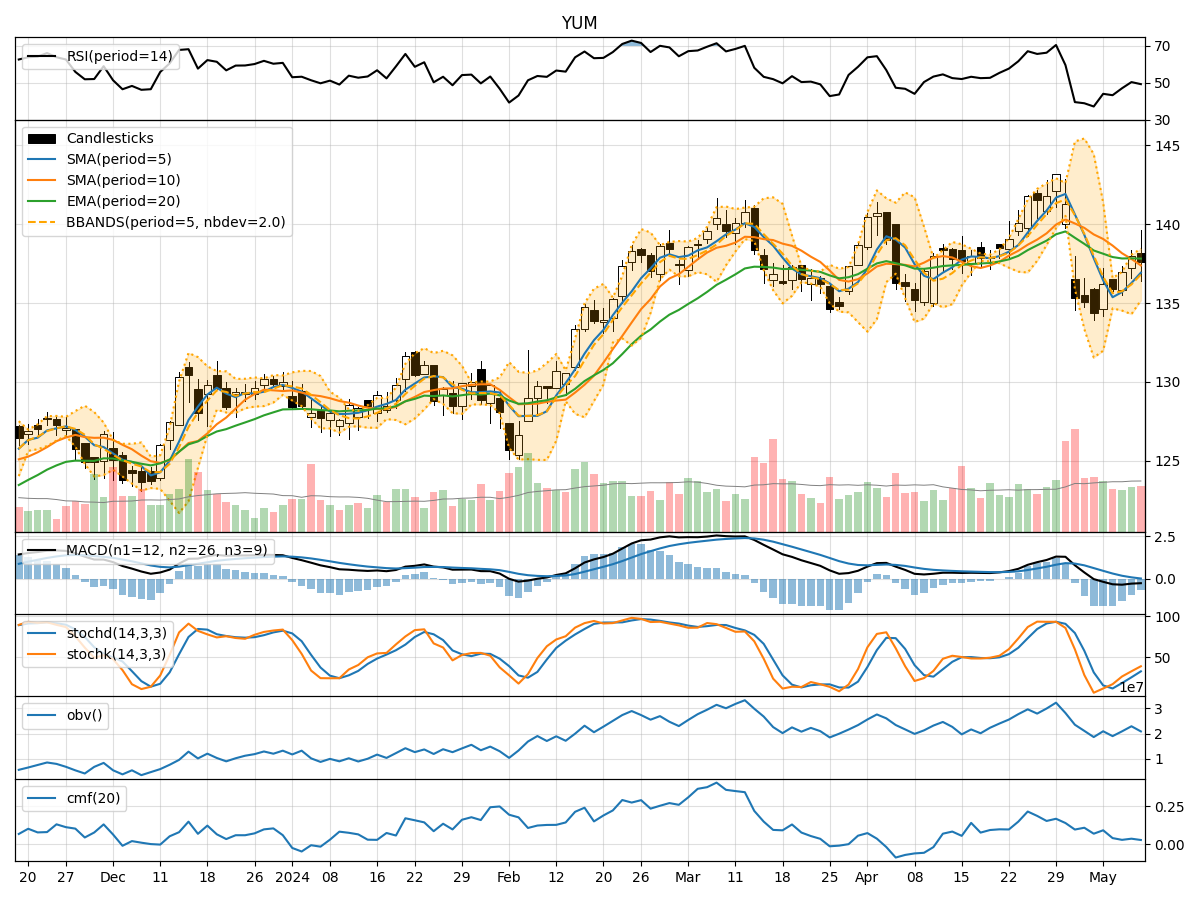
In analyzing the technical indicators for YUM stock over the last 5 days, we will delve into the trend, momentum, volatility, and volume indicators to provide a comprehensive outlook on the possible future stock price movement. By examining these key indicators, we aim to offer valuable insights and predictions for the upcoming trading days.
Trend Analysis:
- Moving Averages (MA): The 5-day Moving Average (MA) has been fluctuating around the mid $136 range, indicating a relatively stable trend in the short term.
- MACD: The Moving Average Convergence Divergence (MACD) has been consistently negative, suggesting a bearish momentum in the stock price.
- EMA: The Exponential Moving Average (EMA) has been slightly declining, reflecting a weakening trend.
Key Observation: The trend indicators point towards a bearish sentiment in the stock price movement.
Momentum Analysis:
- RSI: The Relative Strength Index (RSI) has been hovering around 50, indicating a neutral momentum in the stock.
- Stochastic Oscillator: Both %K and %D have been gradually increasing, suggesting a potential shift towards bullish momentum.
- Williams %R: The Williams %R is in the oversold territory, indicating a possible reversal in the short term.
Key Observation: The momentum indicators show a mixed signal with a slight inclination towards a bullish momentum.
Volatility Analysis:
- Bollinger Bands: The Bollinger Bands have been relatively narrow, indicating low volatility in the stock price.
- Bollinger %B: The %B indicator has been hovering around 0.7, suggesting the stock is trading close to the upper band.
Key Observation: Volatility indicators suggest a low volatility environment with a potential for a breakout in either direction.
Volume Analysis:
- On-Balance Volume (OBV): The OBV has shown mixed movements over the last 5 days, indicating indecision among market participants.
- Chaikin Money Flow (CMF): The CMF has been positive but relatively low, signaling a moderate inflow of money into the stock.
Key Observation: Volume indicators reflect a neutral sentiment with no clear direction in investor sentiment.
Conclusion:
Based on the analysis of the technical indicators, the next few days' possible stock price movement for YUM is likely to be sideways with a slight bullish bias. While trend indicators suggest a bearish sentiment, momentum indicators show a potential shift towards bullish momentum. Volatility remains low, indicating a possible breakout, and volume indicators reflect indecision among investors.
Key Conclusion: The stock is expected to consolidate in the near term with a potential for a slight upward movement. Traders should closely monitor key resistance and support levels for potential entry and exit points.
Remember, market dynamics can change rapidly, so it's essential to stay updated with real-time data and adjust your trading strategy accordingly.