Technical Analysis of YRD 2024-05-10
Overview:
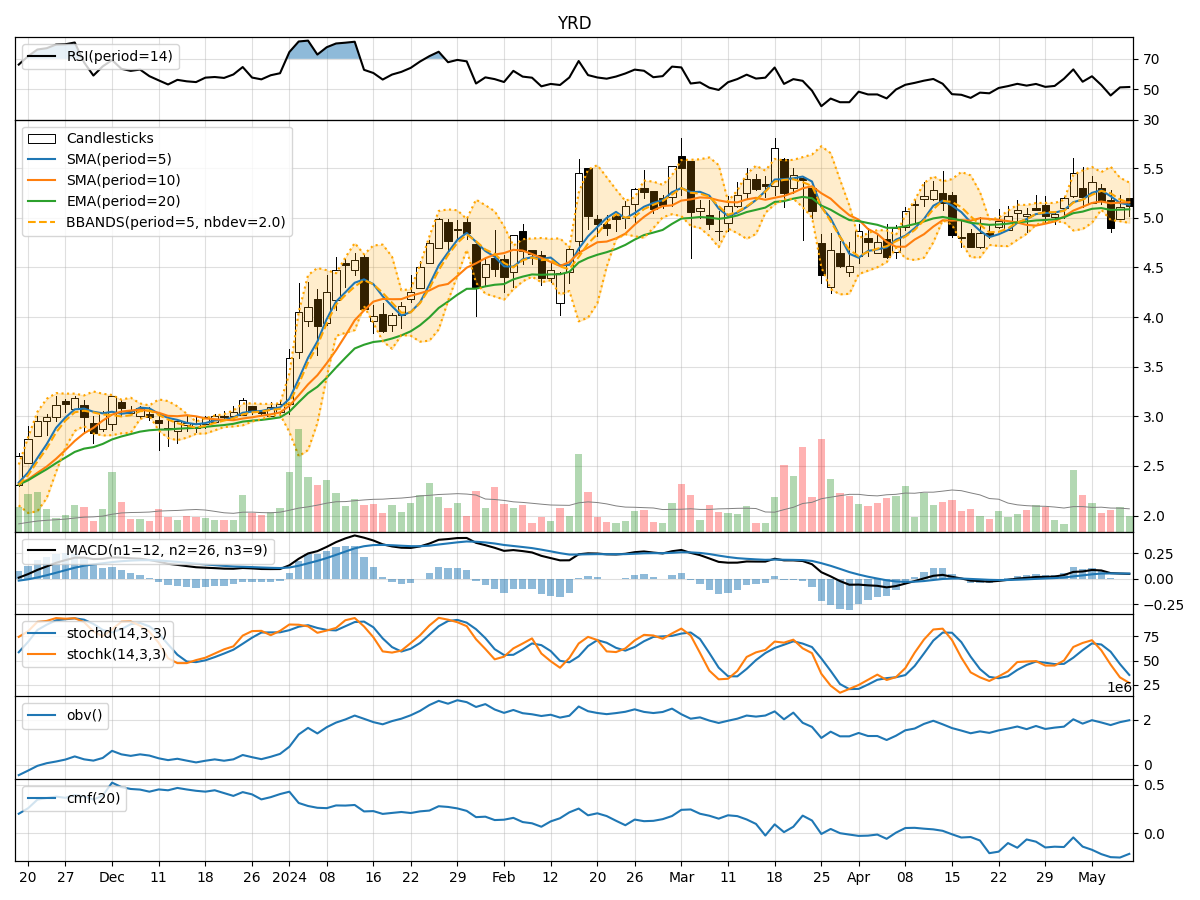
In the last 5 trading days, YRD stock has shown mixed signals across various technical indicators. The stock price has fluctuated within a certain range, indicating indecision in the market. By analyzing trend, momentum, volatility, and volume indicators, we can gain insights into the potential future price movement of YRD stock.
Trend Indicators:
- Moving averages (MA) show a slight uptrend, with the 5-day MA consistently above the 10-day simple moving average (SMA).
- Exponential moving average (EMA) has been relatively stable, indicating a potential consolidation phase.
- Moving Average Convergence Divergence (MACD) is positive but decreasing, suggesting a weakening bullish momentum.
Momentum Indicators:
- Relative Strength Index (RSI) has been fluctuating around the neutral level of 50, indicating a lack of strong momentum.
- Stochastic oscillators show oversold conditions, but the %K and %D lines are not in a clear bullish crossover.
- Williams %R is in the oversold territory, suggesting a potential reversal.
Volatility Indicators:
- Bollinger Bands are narrowing, indicating decreasing volatility and a possible period of consolidation.
- Bollinger Band %B is hovering around the midline, reflecting a lack of clear direction in price movement.
Volume Indicators:
- On-Balance Volume (OBV) has been negative, indicating distribution rather than accumulation.
- Chaikin Money Flow (CMF) is also negative, suggesting selling pressure in the stock.
Key Observations:
- The stock is currently in a consolidation phase, with mixed signals from different indicators.
- Lack of strong momentum and volume support the idea of a sideways movement in the near term.
- Volatility is decreasing, indicating a potential period of price stabilization.
Conclusion:
Based on the analysis of technical indicators, YRD stock is likely to continue trading sideways in the next few days. The lack of clear trend direction, coupled with weakening momentum and negative volume indicators, suggests a period of consolidation. Traders should exercise caution and wait for clearer signals before taking any significant positions.