Technical Analysis of YPF 2024-05-10
Overview:
In analyzing the technical indicators for YPF over the last 5 days, we will delve into the trend, momentum, volatility, and volume indicators to provide a comprehensive outlook on the possible stock price movement in the coming days. By examining these key aspects, we aim to offer valuable insights and recommendations for potential investors.
Trend Analysis:
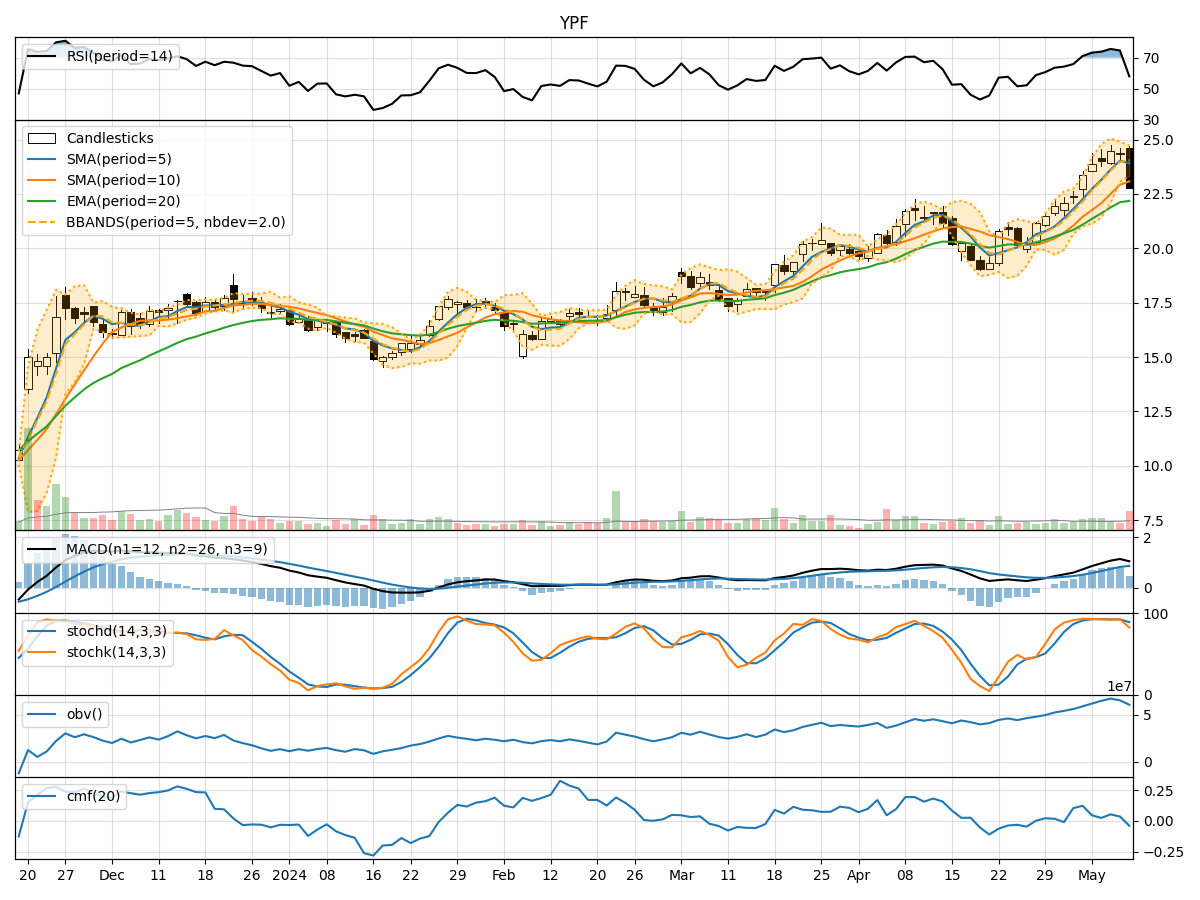
- Moving Averages (MA): The 5-day Moving Average (MA) has been consistently above the Simple Moving Average (SMA) and Exponential Moving Average (EMA), indicating a bullish trend.
- MACD: The MACD line has been above the signal line, with both lines showing an upward trend, suggesting bullish momentum.
- RSI: The Relative Strength Index (RSI) has been in the overbought territory, indicating a strong bullish sentiment.
Momentum Analysis:
- Stochastic Oscillator: Both %K and %D have been relatively high, signaling strong buying momentum.
- Williams %R: The Williams %R is in the oversold region, suggesting a potential reversal in the short term.
Volatility Analysis:
- Bollinger Bands: The stock price has mostly stayed within the Bollinger Bands, with the bands widening slightly, indicating increased volatility.
- Bollinger %B: The %B indicator is close to 0, suggesting the stock is trading near the lower band.
Volume Analysis:
- On-Balance Volume (OBV): The OBV has shown a slight decrease, indicating some distribution of shares.
- Chaikin Money Flow (CMF): The CMF has been positive but decreasing, suggesting a potential weakening of buying pressure.
Key Observations:
- The trend indicators point towards a strong bullish sentiment in the short term.
- Momentum indicators show a mix of bullish and bearish signals, indicating potential consolidation.
- Volatility has increased slightly, which could lead to more significant price swings.
- Volume indicators suggest a slight decrease in buying pressure.
Conclusion:
Based on the analysis of the technical indicators, the next few days' possible stock price movement for YPF is likely to be sideways with a slight bullish bias. Traders should watch for potential reversals indicated by the Williams %R and monitor the volatility for potential breakout opportunities. It is essential to consider the overall market conditions and news developments that could impact the stock price movement.