Technical Analysis of YMM 2024-05-10
Overview:
In analyzing the technical indicators for YMM stock over the last 5 days, we will delve into the trend, momentum, volatility, and volume indicators to provide a comprehensive outlook on the possible stock price movement in the coming days. By examining these key aspects, we aim to offer valuable insights and predictions for informed decision-making.
Trend Analysis:
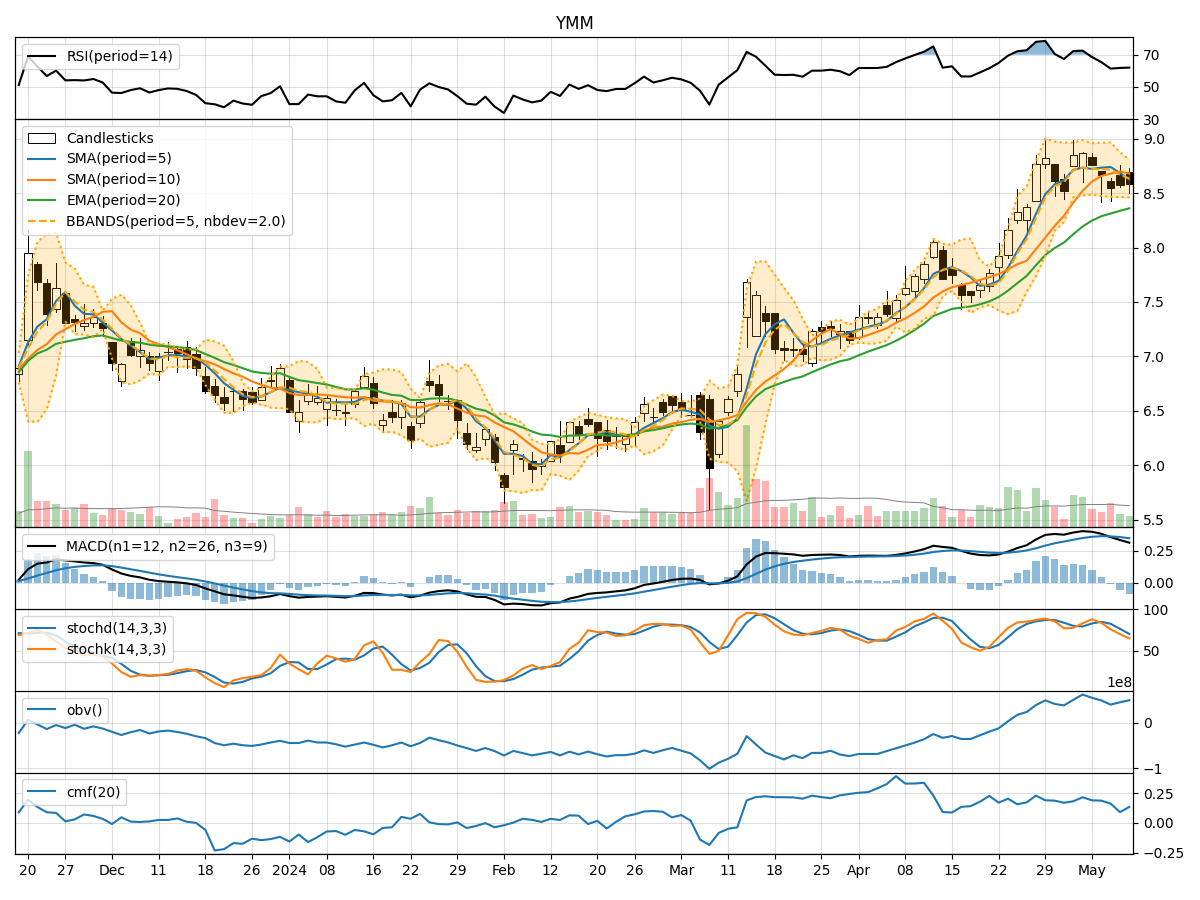
- Moving Averages (MA): The 5-day Moving Average (MA) has been fluctuating around the actual closing prices, indicating a relatively stable trend.
- MACD and Signal Line: The MACD line has been positive, suggesting bullish momentum, although the gap between the MACD and Signal Line has been narrowing.
- Relative Strength Index (RSI): The RSI values have been in the neutral to slightly overbought territory, indicating a balanced market sentiment.
Momentum Analysis:
- Stochastic Oscillator: The Stochastic Oscillator has been gradually decreasing, moving from overbought to oversold levels, signaling a potential reversal in momentum.
- Williams %R (Willr): The Williams %R values have been consistently in the oversold region, indicating a possible buying opportunity.
Volatility Analysis:
- Bollinger Bands (BB): The Bollinger Bands have been narrowing, suggesting decreasing volatility and a potential period of consolidation.
- Bollinger %B (BBP): The %B values have been hovering around the midline, indicating a balanced market sentiment.
Volume Analysis:
- On-Balance Volume (OBV): The OBV values have been fluctuating, reflecting indecision among market participants regarding the stock.
- Chaikin Money Flow (CMF): The CMF values have been relatively low, indicating a lack of strong buying or selling pressure.
Conclusion:
Based on the analysis of the technical indicators, the stock price of YMM is likely to experience sideways movement in the coming days. The narrowing Bollinger Bands and decreasing Stochastic Oscillator suggest a period of consolidation and potential trend reversal. The RSI in the neutral zone and fluctuating OBV further support the view of a balanced market sentiment. Traders may consider adopting a wait-and-see approach until clearer signals emerge in the technical indicators to determine the next significant price direction.