Technical Analysis of XPEV 2024-05-03
Overview:
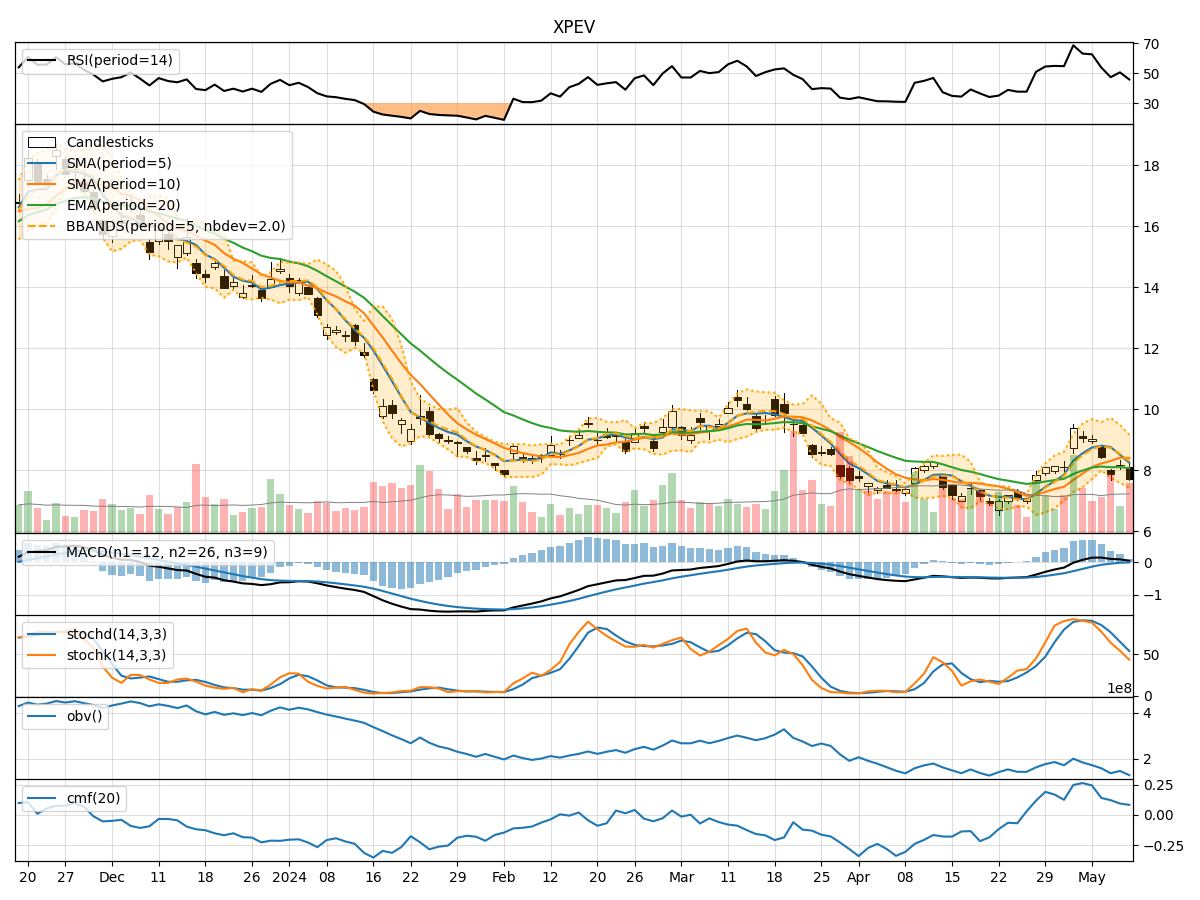
In analyzing the technical indicators for XPEV over the last 5 days, we will delve into the trend, momentum, volatility, and volume indicators to provide a comprehensive outlook on the possible stock price movement. By examining these key factors, we aim to offer valuable insights and predictions for the upcoming days.
Trend Analysis:
- Moving Averages (MA): The 5-day MA has been consistently rising, indicating a bullish trend in the short term.
- MACD: The MACD line has been above the signal line, suggesting a bullish momentum.
- EMA: The EMA has been trending upwards, supporting the bullish sentiment.
Key Observation: The trend indicators point towards a bullish outlook for XPEV.
Momentum Analysis:
- RSI: The RSI has been fluctuating but generally staying within the neutral range, indicating a balanced momentum.
- Stochastic Oscillator: Both %K and %D have been in the overbought territory, suggesting a potential reversal.
- Williams %R: The indicator has been in the oversold region, signaling a possible buying opportunity.
Key Observation: Momentum indicators show mixed signals, with a slight bias towards a bearish reversal.
Volatility Analysis:
- Bollinger Bands: The stock price has been trading within the bands, indicating moderate volatility.
- Bollinger %B: The %B has been fluctuating around the midline, reflecting a balanced volatility level.
Key Observation: Volatility indicators suggest a stable price movement with no extreme fluctuations.
Volume Analysis:
- On-Balance Volume (OBV): The OBV has been fluctuating, indicating indecision among investors.
- Chaikin Money Flow (CMF): The CMF has been positive but trending downwards, signaling potential selling pressure.
Key Observation: Volume indicators reflect a lack of strong conviction among market participants.
Conclusion:
Based on the analysis of trend, momentum, volatility, and volume indicators, the next few days' possible stock price movement for XPEV is likely to experience a consolidation phase. The bullish trend indicated by moving averages and MACD may face resistance due to the mixed signals from momentum indicators. The stable volatility and indecisive volume further support the view of a sideways movement.
In conclusion, the stock price of XPEV is expected to consolidate in the near term, with a potential for a slight downward bias as momentum weakens. Traders should exercise caution and closely monitor key support and resistance levels for potential trading opportunities.