Technical Analysis of XIN 2024-05-10
Overview:
In analyzing the technical indicators for XIN stock over the last 5 days, we will delve into the trend, momentum, volatility, and volume indicators to provide a comprehensive outlook on the possible future stock price movement. By examining these key indicators, we aim to offer valuable insights and recommendations for potential investors.
Trend Analysis:
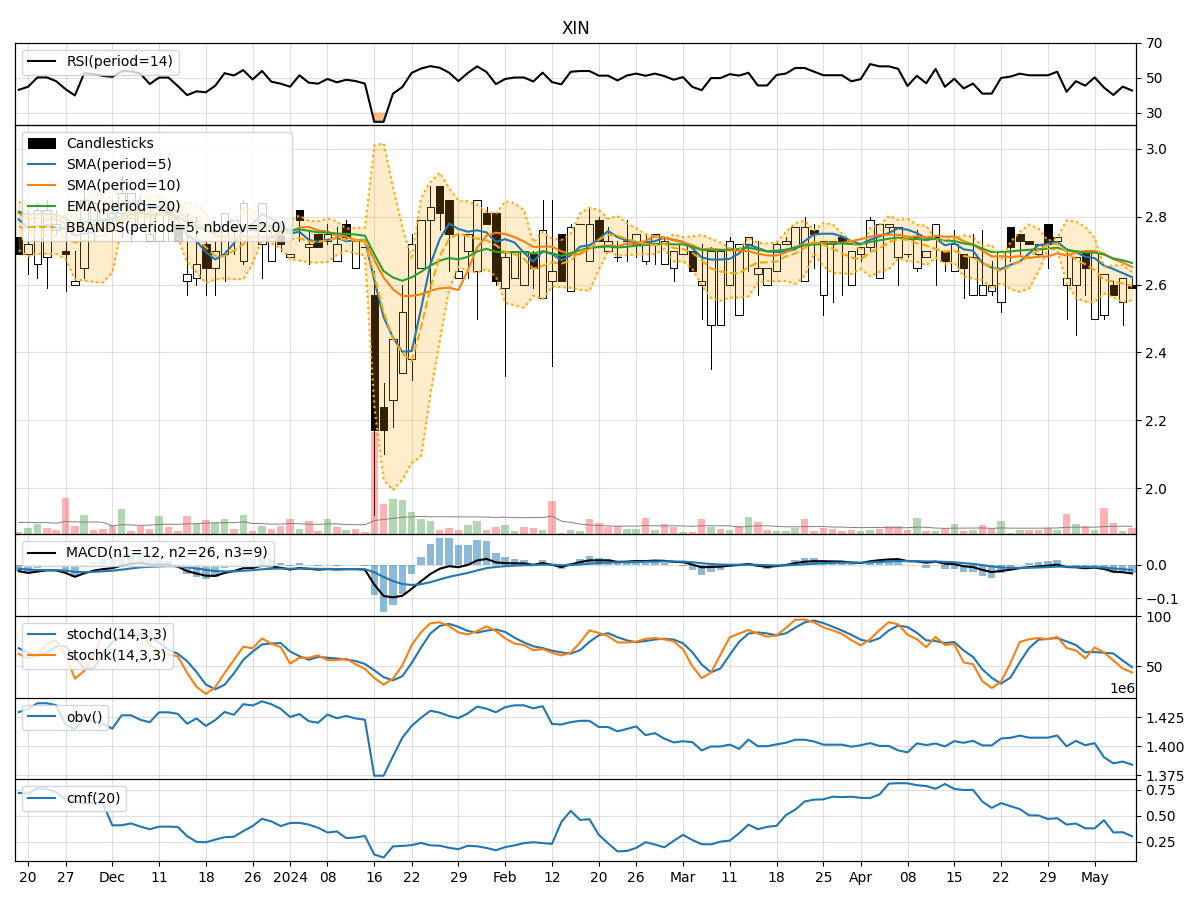
- Moving Averages (MA): The 5-day Moving Average (MA) has been declining steadily, indicating a bearish trend in the short term.
- MACD: The Moving Average Convergence Divergence (MACD) has been consistently negative, suggesting a bearish momentum in the stock price.
- EMA: The Exponential Moving Average (EMA) has also been trending downwards, aligning with the bearish sentiment in the short term.
Momentum Analysis:
- RSI: The Relative Strength Index (RSI) has been hovering around the oversold territory, indicating a potential reversal or consolidation phase.
- Stochastic Oscillator: Both %K and %D of the Stochastic Oscillator are in the oversold region, signaling a possible buying opportunity.
- Williams %R: The Williams %R is also in the oversold zone, suggesting a potential bounce back in the stock price.
Volatility Analysis:
- Bollinger Bands: The Bollinger Bands are narrowing, indicating decreasing volatility and a possible period of consolidation.
- Bollinger %B: The %B indicator is below 0.2, suggesting that the stock price is nearing the lower band and may see a reversal or bounce.
Volume Analysis:
- On-Balance Volume (OBV): The OBV has been declining, indicating selling pressure in the stock.
- Chaikin Money Flow (CMF): The CMF is positive but decreasing, suggesting that money flow into the stock is slowing down.
Conclusion:
Based on the analysis of the technical indicators, the stock is currently in a bearish phase with downward trends in moving averages, MACD, and EMA. However, the momentum indicators like RSI, Stochastic Oscillator, and Williams %R are showing signs of potential reversal or consolidation. The volatility is decreasing, indicating a possible period of consolidation, while the volume indicators reflect selling pressure but with a slowing down in money outflow.
Recommendation:
Considering the overall analysis, the stock may experience a short-term consolidation or sideways movement before a potential reversal. Investors should closely monitor the momentum indicators for any signs of a bullish reversal and wait for confirmation before considering any buying opportunities. It is crucial to set stop-loss levels to manage risk effectively in case the bearish trend continues.