Technical Analysis of WY 2024-05-10
Overview:
In analyzing the technical indicators for WY over the last 5 days, we will delve into the trend, momentum, volatility, and volume indicators to provide a comprehensive assessment of the stock's potential price movement. By examining these key factors, we aim to offer valuable insights and predictions for the next few days.
Trend Analysis:
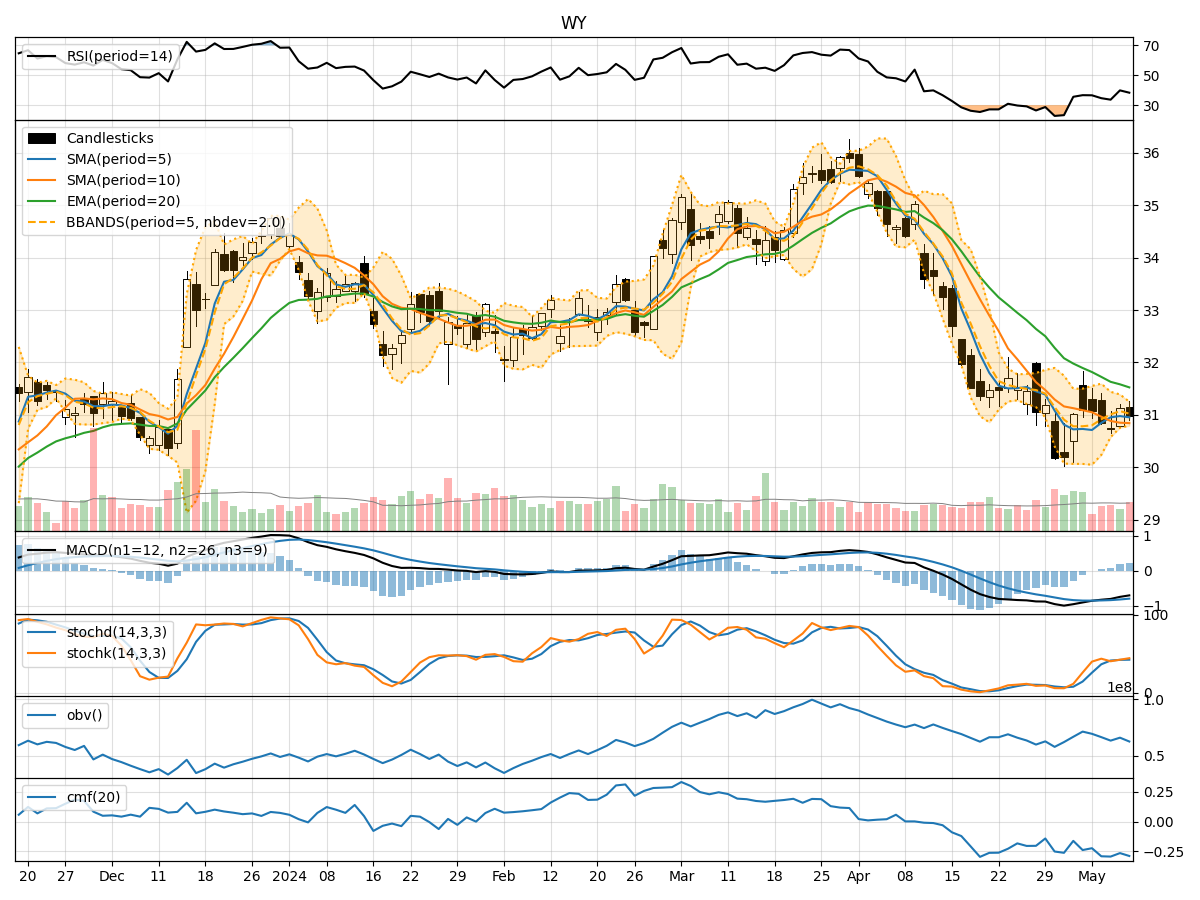
- Moving Averages (MA): The 5-day Moving Average (MA) has been fluctuating around the Simple Moving Average (SMA) and Exponential Moving Average (EMA) values, indicating a lack of clear trend direction.
- MACD: The Moving Average Convergence Divergence (MACD) has been negative but showing signs of improvement, with the MACD line approaching the signal line.
Key Observation: The trend indicators suggest a neutral to slightly bearish sentiment in the short term.
Momentum Analysis:
- RSI: The Relative Strength Index (RSI) has been hovering around the mid-range, indicating a balanced momentum between buying and selling pressure.
- Stochastic Oscillator: Both %K and %D values of the Stochastic Oscillator are in the neutral zone, suggesting a lack of strong momentum direction.
Key Observation: Momentum indicators reflect a neutral stance with no clear bias towards either bullish or bearish momentum.
Volatility Analysis:
- Bollinger Bands (BB): The Bollinger Bands have shown narrowing volatility, with the stock price moving closer to the lower band.
Key Observation: Volatility has decreased, potentially signaling a period of consolidation or a forthcoming breakout.
Volume Analysis:
- On-Balance Volume (OBV): The OBV has been fluctuating, indicating mixed volume flow in the stock.
- Chaikin Money Flow (CMF): The CMF has been negative, suggesting a slight distribution phase.
Key Observation: Volume indicators point towards indecision in market participation, with no clear accumulation or distribution pattern.
Conclusion:
Based on the analysis of the technical indicators, the next few days for WY stock are likely to see sideways movement with a slight bearish bias. The lack of strong trends in the trend and momentum indicators, coupled with decreasing volatility and mixed volume signals, indicates a period of consolidation or range-bound trading.
Recommendation: It is advisable for traders to exercise caution and closely monitor key support and resistance levels for potential breakout or reversal signals. Consider implementing risk management strategies to navigate the uncertain market conditions effectively.