Technical Analysis of WRK 2024-05-10
Overview:
In analyzing the technical indicators for WRK over the last 5 days, we will delve into the trend, momentum, volatility, and volume indicators to provide a comprehensive outlook on the possible stock price movement. By examining these key factors, we aim to offer valuable insights and predictions for the upcoming days.
Trend Analysis:
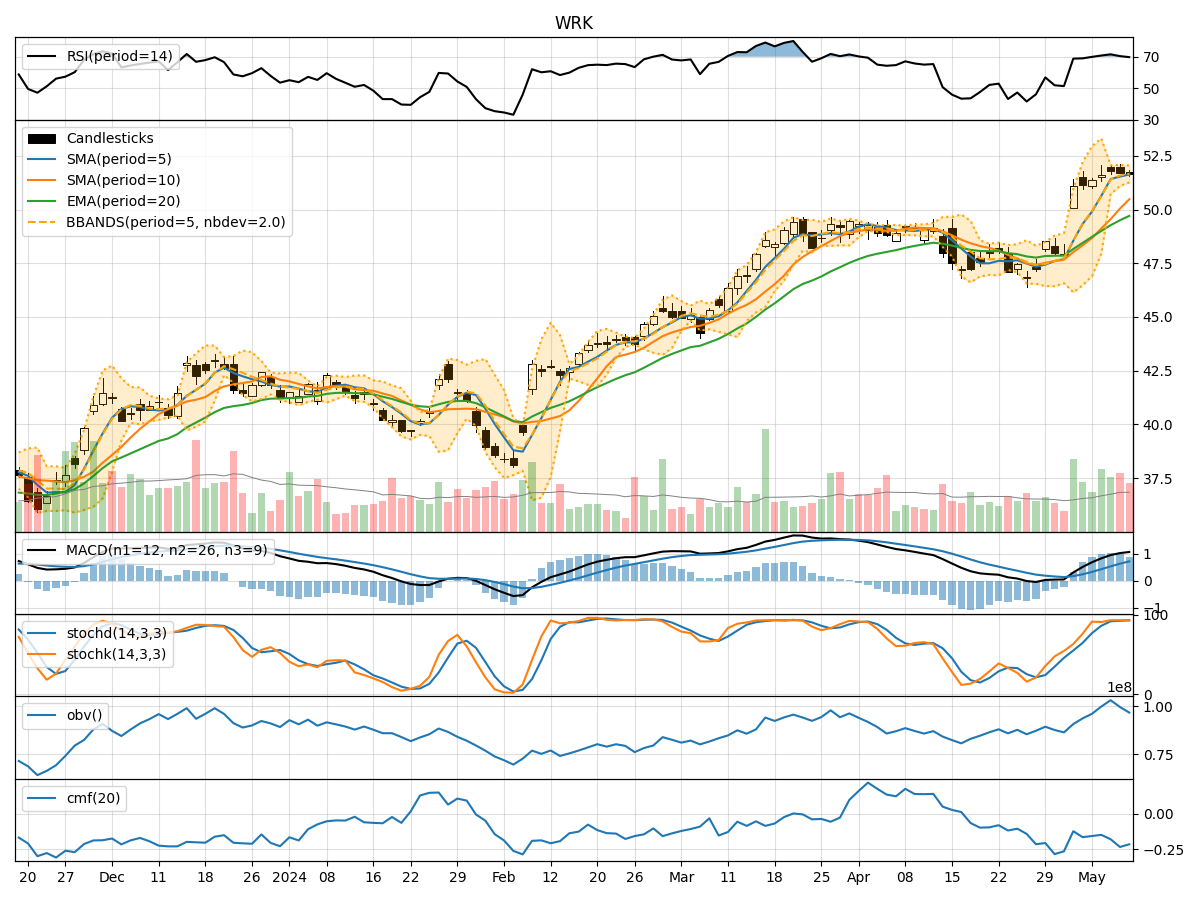
- Moving Averages (MA): The moving averages have been trending upwards consistently, indicating a bullish momentum in the stock price.
- MACD: The MACD line has been above the signal line, suggesting a positive trend in the stock price.
- EMA: The exponential moving average has been steadily increasing, supporting the bullish trend.
Momentum Analysis:
- RSI: The Relative Strength Index has been in the overbought territory, signaling a strong bullish momentum.
- Stochastic Oscillator: Both %K and %D have been in the overbought zone, indicating a potential reversal or consolidation.
- Williams %R: The indicator has been in the oversold region, suggesting a possible reversal in the stock price.
Volatility Analysis:
- Bollinger Bands: The bands have been narrowing, indicating decreasing volatility and a potential period of consolidation.
- Bollinger %B: The %B indicator has been decreasing, suggesting a possible shift towards a more neutral stance.
Volume Analysis:
- On-Balance Volume (OBV): The OBV has been fluctuating, indicating mixed buying and selling pressure in the stock.
- Chaikin Money Flow (CMF): The CMF has been negative, suggesting a bearish sentiment in the stock.
Key Observations:
- The trend indicators point towards a bullish outlook, supported by moving averages and MACD.
- Momentum indicators show a strong bullish momentum but also hint at potential overbought conditions.
- Volatility indicators suggest a period of consolidation and decreasing volatility.
- Volume indicators reflect mixed sentiment with fluctuating OBV and negative CMF.
Conclusion:
Based on the analysis of the technical indicators, the next few days for WRK could see a continuation of the bullish trend but with a possibility of consolidation or a minor pullback due to overbought conditions indicated by momentum indicators. The narrowing Bollinger Bands also support the idea of a potential consolidation phase. Traders should monitor key support and resistance levels closely to assess the stock's price action and adjust their strategies accordingly.