Technical Analysis of WRB 2024-05-10
Overview:
In analyzing the provided WRB TA data for the last 5 days, we will delve into the technical indicators across trend, momentum, volatility, and volume to derive insights into the possible future stock price movement. By examining key metrics such as moving averages, MACD, RSI, Stochastic indicators, Bollinger Bands, and OBV, we aim to provide a comprehensive and insightful analysis to guide your decision-making process.
Trend Analysis:
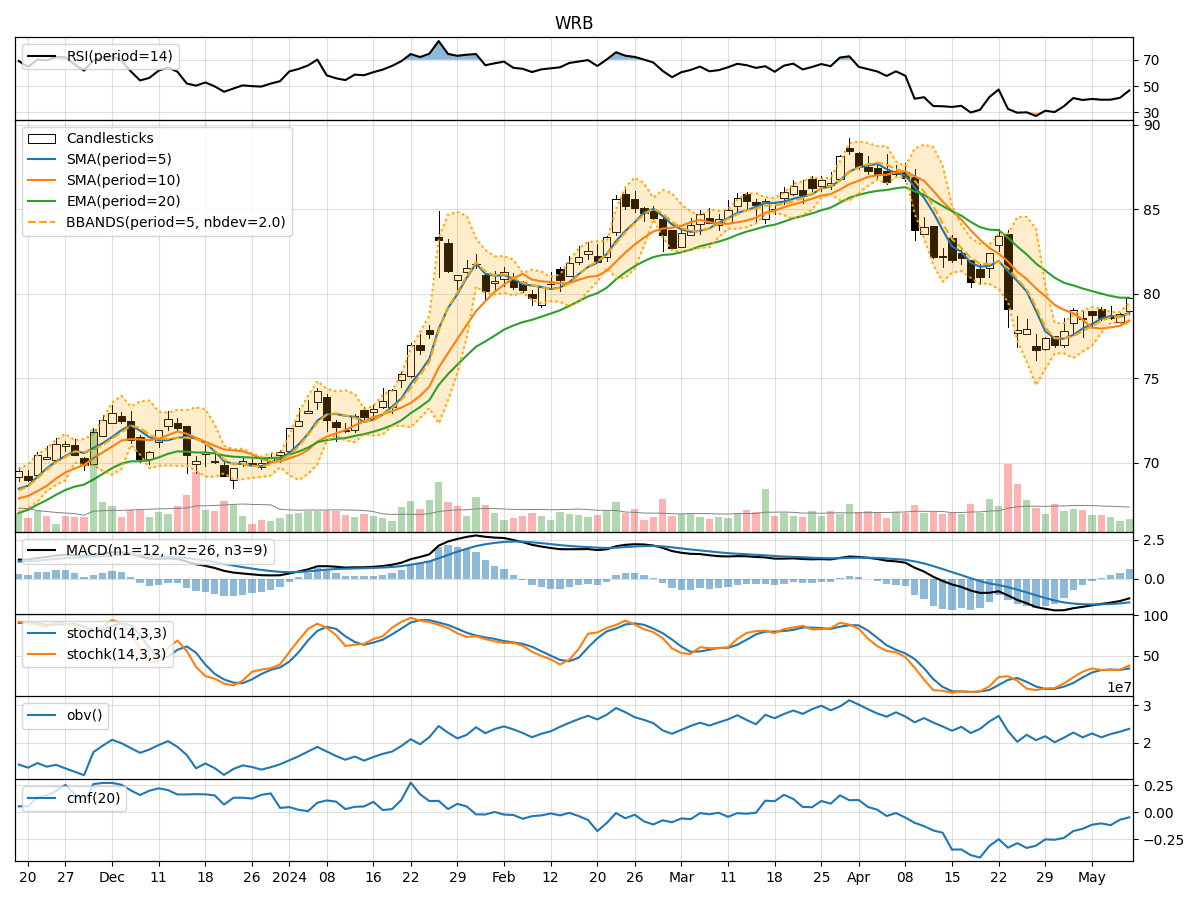
- Moving Averages (MA): The 5-day MA has been trending above the closing prices, indicating a short-term uptrend.
- MACD: The MACD line has been consistently below the signal line, suggesting a bearish momentum.
- EMA: The EMA(20) has been gradually declining, reflecting a weakening trend.
Momentum Analysis:
- RSI: The RSI has been fluctuating around the mid-level, indicating a lack of strong momentum.
- Stochastic Oscillator: Both %K and %D have been hovering in the oversold territory, signaling a potential reversal.
- Williams %R: The indicator has been moving towards the oversold region, suggesting a possible buying opportunity.
Volatility Analysis:
- Bollinger Bands: The stock price has been trading within the bands, with the %B indicator showing fluctuations within the range.
- BB Width: The bands have shown narrowing width, indicating decreasing volatility.
Volume Analysis:
- On-Balance Volume (OBV): The OBV has been fluctuating, reflecting indecision among market participants.
- Chaikin Money Flow (CMF): The CMF has been negative, indicating selling pressure in the market.
Key Observations:
- The stock is currently in a sideways consolidation phase, with mixed signals from different indicators.
- The trend is weakening based on the declining EMA(20) and bearish MACD.
- Momentum indicators suggest a potential reversal with stochastic indicators nearing oversold levels.
- Volatility has been decreasing, indicating a possible period of price stabilization.
- Volume indicators show indecisiveness among investors, with selling pressure reflected in CMF.
Conclusion:
Based on the analysis of the technical indicators, the next few days may see the stock price experiencing sideways movement with a slight bias towards a bearish outlook. Traders should exercise caution and wait for clearer signals before making significant trading decisions. It is advisable to monitor key levels such as support and resistance for potential breakout opportunities.