Technical Analysis of WNS 2024-05-03
Overview:
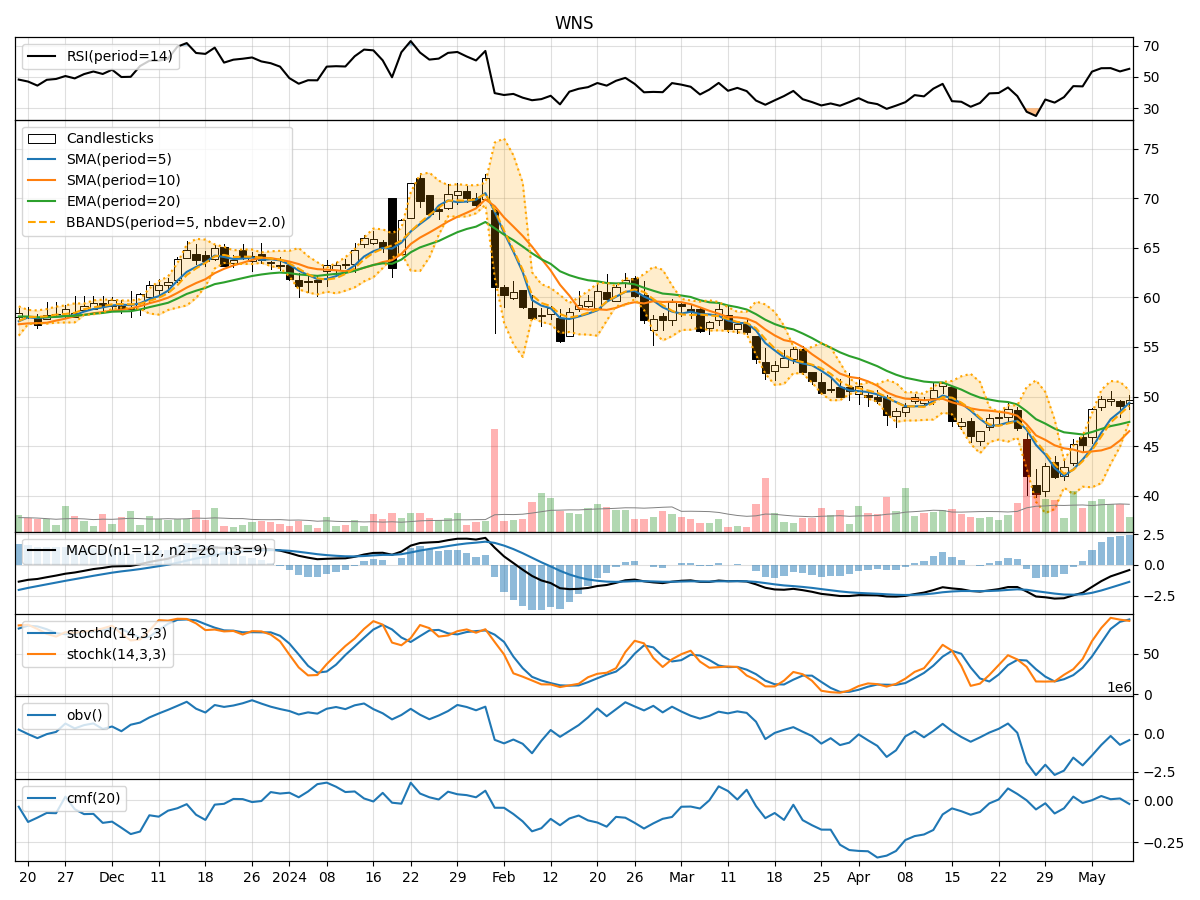
In analyzing the technical indicators for WNS over the last 5 days, we will delve into the trend, momentum, volatility, and volume indicators to provide a comprehensive outlook on the possible stock price movement in the coming days.
Trend Analysis:
- Moving Averages (MA): The 5-day MA has been consistently below the closing prices, indicating a downward trend.
- MACD: The MACD line has been below the signal line, suggesting bearish momentum.
- EMA: The exponential moving average has also been trending downwards.
Key Observation: The trend indicators point towards a bearish outlook for WNS.
Momentum Analysis:
- RSI: The Relative Strength Index has been relatively low, indicating bearish momentum.
- Stochastic Oscillator: Both %K and %D have been in the oversold territory, signaling a potential reversal.
- Williams %R: The indicator has been in the oversold region, suggesting a possible upward movement.
Key Observation: Momentum indicators show a mixed signal, with some indicators hinting at a potential reversal.
Volatility Analysis:
- Bollinger Bands: The bands have been narrowing, indicating decreasing volatility.
- Bollinger %B: The %B has been fluctuating within a range, suggesting consolidation.
- Average True Range (ATR): ATR has been relatively stable over the past few days.
Key Observation: Volatility indicators suggest a period of consolidation and low volatility.
Volume Analysis:
- On-Balance Volume (OBV): The OBV has been declining, indicating selling pressure.
- Chaikin Money Flow (CMF): The CMF has been negative, reflecting a lack of buying interest.
Key Observation: Volume indicators point towards bearish sentiment and lack of buying pressure.
Conclusion:
Based on the analysis of the technical indicators, the overall outlook for WNS in the next few days leans towards a continuation of the bearish trend. While momentum indicators show a possibility of a reversal, the trend and volume indicators strongly suggest a downward movement. The volatility indicators indicate a consolidation phase with low volatility.
In conclusion, the next few days for WNS are likely to see a continuation of the bearish trend, with a potential for a reversal in momentum. Traders should exercise caution and closely monitor key support and resistance levels for potential entry or exit points.