Technical Analysis of WFG 2024-05-10
Overview:
In analyzing the technical indicators for WFG stock over the last 5 days, we will delve into the trend, momentum, volatility, and volume indicators to provide a comprehensive outlook on the possible future stock price movement. By examining these key indicators, we aim to offer valuable insights and predictions for the upcoming trading days.
Trend Analysis:
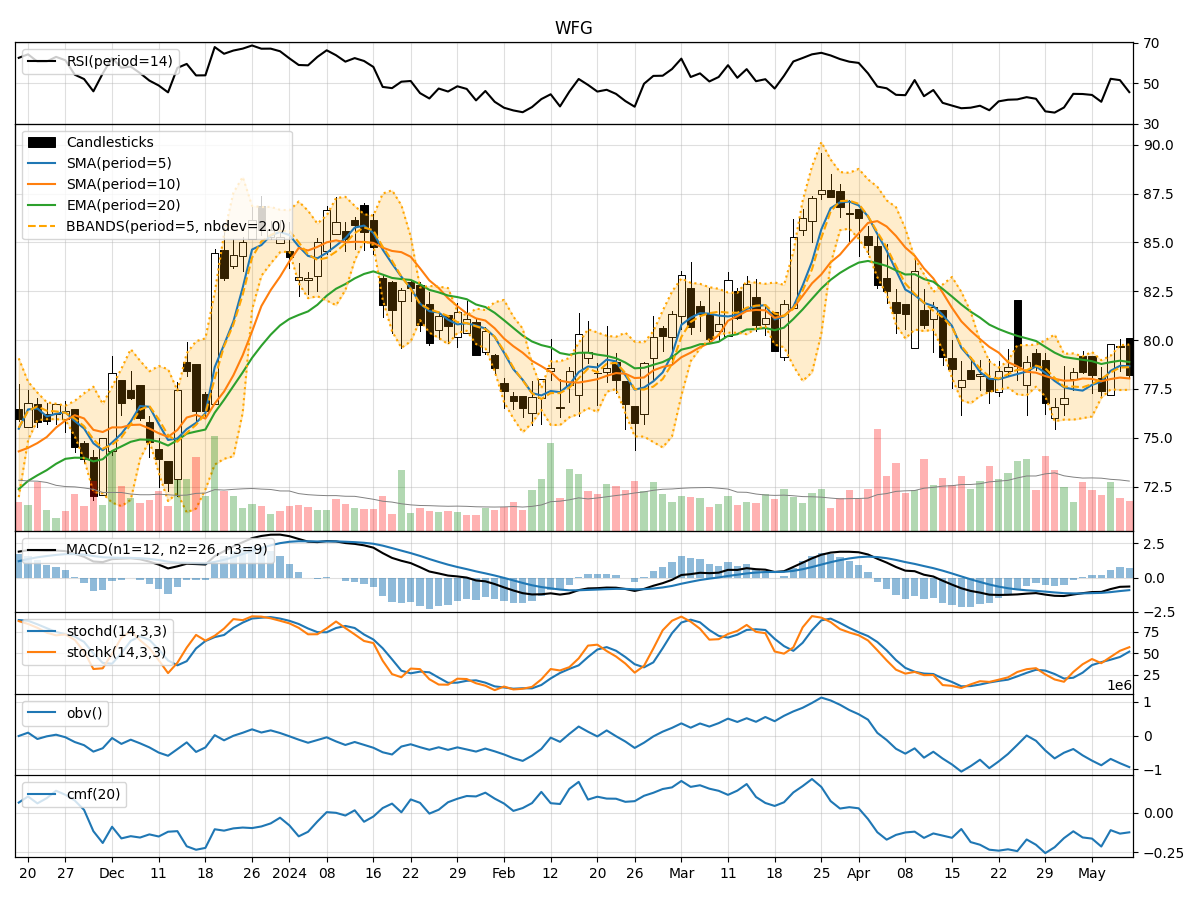
- Moving Averages (MA): The 5-day Moving Average (MA) has been fluctuating around the closing prices, indicating short-term price trends. The Simple Moving Average (SMA) and Exponential Moving Average (EMA) show a mixed trend, with the EMA slightly above the SMA.
- MACD: The Moving Average Convergence Divergence (MACD) has been negative but showing signs of convergence towards the signal line, suggesting a potential reversal in the short term.
Momentum Analysis:
- RSI: The Relative Strength Index (RSI) has been hovering around the mid-level, indicating a neutral momentum in the stock.
- Stochastic Oscillator: The Stochastic Oscillator shows a recent uptrend, reaching the overbought territory, which might signal a potential reversal or consolidation.
- Williams %R: The Williams %R indicator suggests an oversold condition, potentially indicating a buying opportunity.
Volatility Analysis:
- Bollinger Bands: The Bollinger Bands are narrowing, indicating decreasing volatility in the stock price. This could precede a period of consolidation or a breakout in either direction.
Volume Analysis:
- On-Balance Volume (OBV): The OBV has been fluctuating, indicating mixed buying and selling pressure in the stock.
- Chaikin Money Flow (CMF): The CMF has been negative, suggesting a lack of buying interest in the stock over the past 20 days.
Key Observations:
- The stock is currently in a consolidation phase, as indicated by the narrowing Bollinger Bands and mixed moving averages.
- Momentum indicators show conflicting signals, with RSI neutral, Stochastic overbought, and Williams %R oversold.
- Volume indicators suggest a lack of strong buying interest, reflected in the negative CMF.
Conclusion:
Based on the analysis of the technical indicators, the next few days for WFG stock could see sideways movement or consolidation. The conflicting signals from the momentum indicators and the lack of strong buying interest reflected in the volume indicators suggest a period of indecision in the market. Traders may consider waiting for clearer signals or confirmation of a trend before making significant trading decisions.