Technical Analysis of WFC 2024-05-10
Overview:
In analyzing the technical indicators for Wells Fargo (WFC) over the last 5 days, we will delve into the trend, momentum, volatility, and volume indicators to provide a comprehensive outlook on the possible stock price movement in the coming days. By examining these key indicators, we aim to offer valuable insights and recommendations for potential investors.
Trend Analysis:
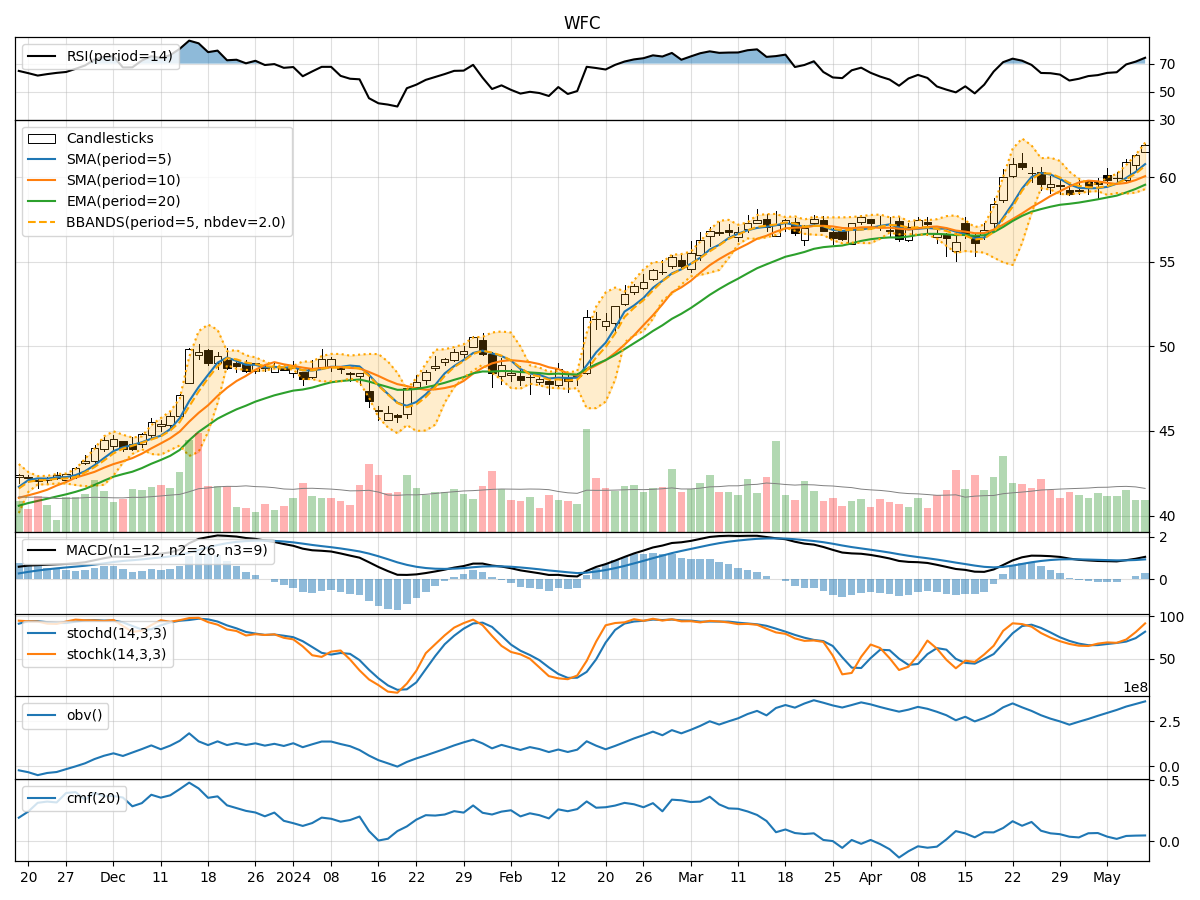
- Moving Averages (MA): The 5-day MA has been consistently above the closing prices, indicating a short-term uptrend.
- MACD: The MACD line has been trending upwards, with the MACD histogram showing positive values, suggesting bullish momentum.
- RSI: The RSI values have been increasing, reflecting strengthening bullish momentum.
Key Observation: The trend indicators suggest a bullish sentiment in the short term.
Momentum Analysis:
- Stochastic Oscillator: Both %K and %D values have been rising, indicating increasing buying pressure.
- Williams %R: The Williams %R values have been improving, moving away from oversold conditions.
Key Observation: Momentum indicators align with the bullish sentiment, indicating potential further upside momentum.
Volatility Analysis:
- Bollinger Bands (BB): The stock price has been trading above the middle Bollinger Band, suggesting an upward trend.
Key Observation: Volatility indicators support the bullish outlook, with the price likely to continue its upward movement.
Volume Analysis:
- On-Balance Volume (OBV): The OBV has been steadily increasing, indicating strong buying interest.
- Chaikin Money Flow (CMF): The CMF values have been positive, signaling accumulation by investors.
Key Observation: Volume indicators confirm the bullish sentiment, with strong buying volume supporting the upward price movement.
Conclusion:
Based on the analysis of the technical indicators across trend, momentum, volatility, and volume, the next few days are likely to see continued upward movement in WFC stock price. The bullish trend is supported by positive momentum, increasing buying pressure, low volatility, and strong volume accumulation. Investors may consider maintaining or initiating long positions in WFC, as the technical analysis points towards further upside potential.
Key Conclusion: Bullish sentiment is dominant, indicating a high probability of upward price movement in the coming days.