Technical Analysis of VZ 2024-05-10
Overview:
In analyzing the technical indicators for Verizon (VZ) stock over the last 5 days, we will delve into the trends, momentum, volatility, and volume indicators to provide a comprehensive outlook on the possible future stock price movement. By examining these key aspects, we aim to offer valuable insights and recommendations for potential investors.
Trend Analysis:
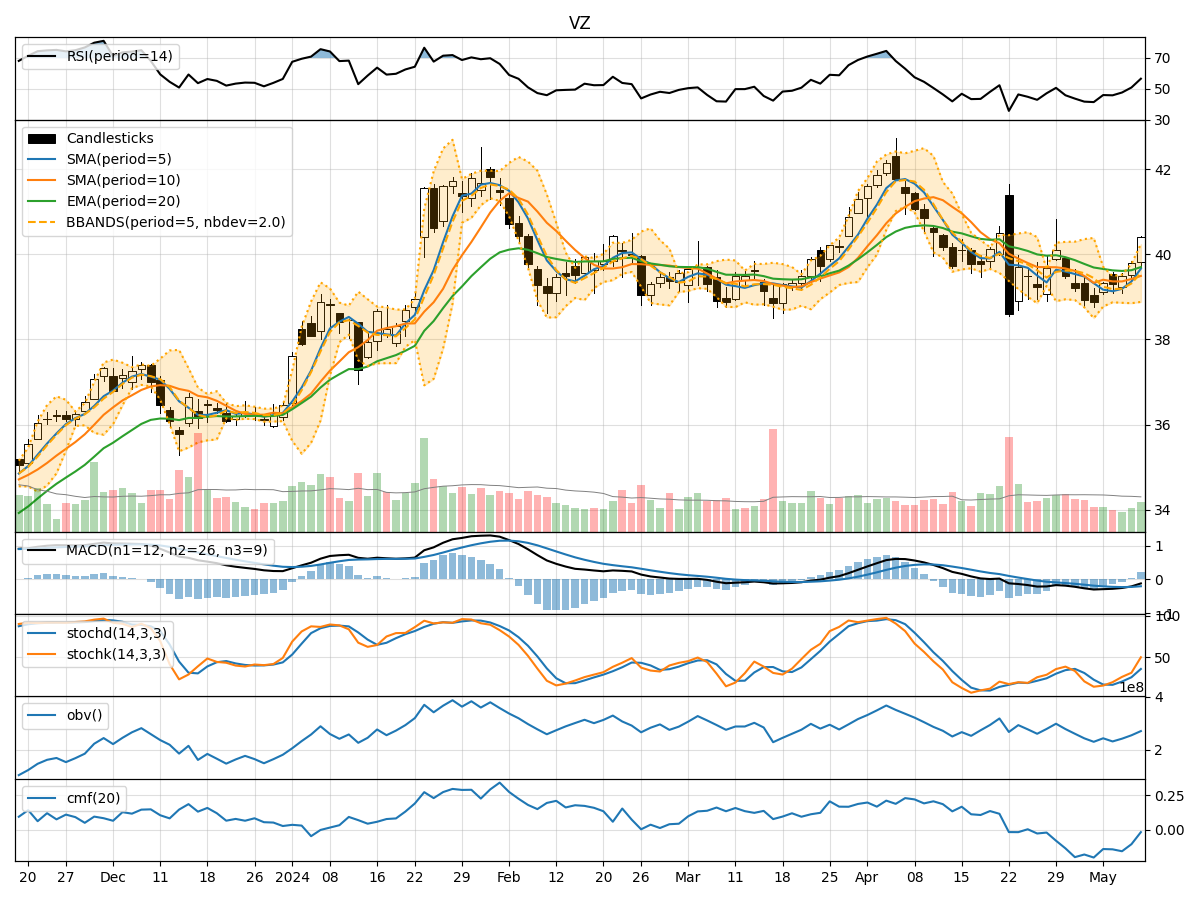
- Moving Averages (MA): The 5-day Moving Average (MA) has been fluctuating around the closing prices, indicating short-term price trends. The Simple Moving Average (SMA) and Exponential Moving Average (EMA) show a slight downward trend, with the EMA lagging behind.
- MACD: The Moving Average Convergence Divergence (MACD) has been negative, suggesting a bearish momentum in the stock price.
- Conclusion: The trend indicators point towards a bearish sentiment in the short term.
Momentum Analysis:
- RSI: The Relative Strength Index (RSI) has been gradually increasing, indicating a strengthening momentum in the stock.
- Stochastic Oscillator: Both %K and %D values have been rising, suggesting an uptrend in momentum.
- Conclusion: Momentum indicators signal a bullish sentiment in the stock.
Volatility Analysis:
- Bollinger Bands (BB): The Bollinger Bands show an expanding range, indicating increased volatility in the stock price.
- Conclusion: Volatility indicators suggest a volatile trading environment for the stock.
Volume Analysis:
- On-Balance Volume (OBV): The OBV has shown mixed signals, with fluctuations in volume accumulation.
- Chaikin Money Flow (CMF): The CMF has been negative, indicating a bearish money flow.
- Conclusion: Volume indicators reflect a neutral to bearish sentiment in the stock.
Key Observations:
- Trend: The trend indicators point towards a bearish outlook in the short term.
- Momentum: Momentum indicators suggest a bullish momentum in the stock.
- Volatility: Volatility indicators highlight an increase in price fluctuations.
- Volume: Volume indicators show a mixed to bearish sentiment in terms of accumulation and money flow.
Conclusion:
Based on the analysis of the technical indicators, the next few days' possible stock price movement for Verizon (VZ) is likely to be mixed with a slight bearish bias in the short term. Investors should exercise caution and closely monitor the evolving trends and momentum to make informed decisions.