Technical Analysis of VTMX 2024-05-10
Overview:
In analyzing the technical indicators for VTMX over the last 5 days, we will delve into the trend, momentum, volatility, and volume indicators to provide a comprehensive outlook on the possible stock price movement in the coming days. By examining these key aspects, we aim to offer valuable insights and predictions for potential investors.
Trend Analysis:
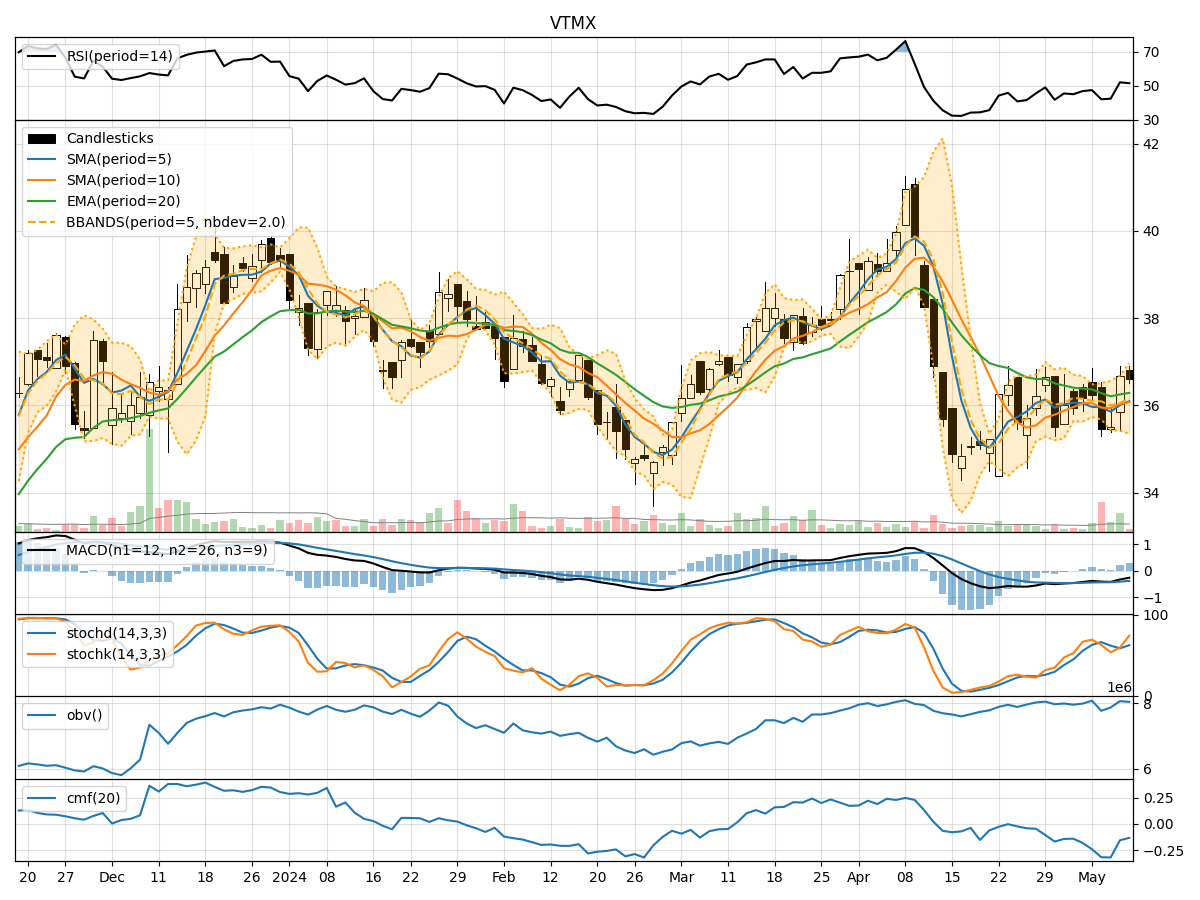
- Moving Averages (MA): The 5-day Moving Average (MA) has been fluctuating around the actual closing prices, indicating a lack of clear trend direction.
- MACD and Signal Line: The MACD has been negative but showing signs of convergence with the signal line, suggesting a potential shift in momentum.
- EMA: The Exponential Moving Average (EMA) has been declining slightly, indicating a bearish sentiment in the short term.
Momentum Analysis:
- RSI: The Relative Strength Index (RSI) has been hovering around the mid-level, indicating a neutral momentum.
- Stochastic Oscillator: The Stochastic indicators have shown mixed signals, with some days indicating overbought conditions and others oversold.
- Williams %R: The Williams %R has been fluctuating but generally staying within the oversold territory.
Volatility Analysis:
- Bollinger Bands: The Bollinger Bands have been widening, suggesting increased volatility in the stock price.
- Bollinger %B: The %B indicator has been fluctuating within a wide range, indicating potential price extremes.
- Average True Range (ATR): The ATR has shown an increase in volatility over the last few days.
Volume Analysis:
- On-Balance Volume (OBV): The OBV has been fluctuating, indicating mixed buying and selling pressure.
- Chaikin Money Flow (CMF): The CMF has been negative, suggesting a lack of strong buying interest in the stock.
Key Observations:
- The trend indicators show a lack of clear direction, with some signs of potential reversal in momentum.
- Momentum indicators suggest a neutral stance with mixed signals on overbought and oversold conditions.
- Volatility has increased, indicating potential price swings in the coming days.
- Volume indicators reflect mixed buying and selling pressure, with a lack of strong buying interest.
Conclusion:
Based on the analysis of the technical indicators, the stock price of VTMX is likely to experience sideways movement in the next few days. The lack of a clear trend direction, mixed momentum signals, increased volatility, and neutral volume indicators suggest a period of consolidation. Investors should exercise caution and closely monitor the price action for any potential breakout or trend reversal before making any trading decisions.