Technical Analysis of VLRS 2024-05-10
Overview:
In analyzing the technical indicators for VLRS over the last 5 days, we will delve into the trend, momentum, volatility, and volume indicators to provide a comprehensive outlook on the possible stock price movement. By examining these key aspects, we aim to offer valuable insights and predictions for the upcoming days.
Trend Indicators:
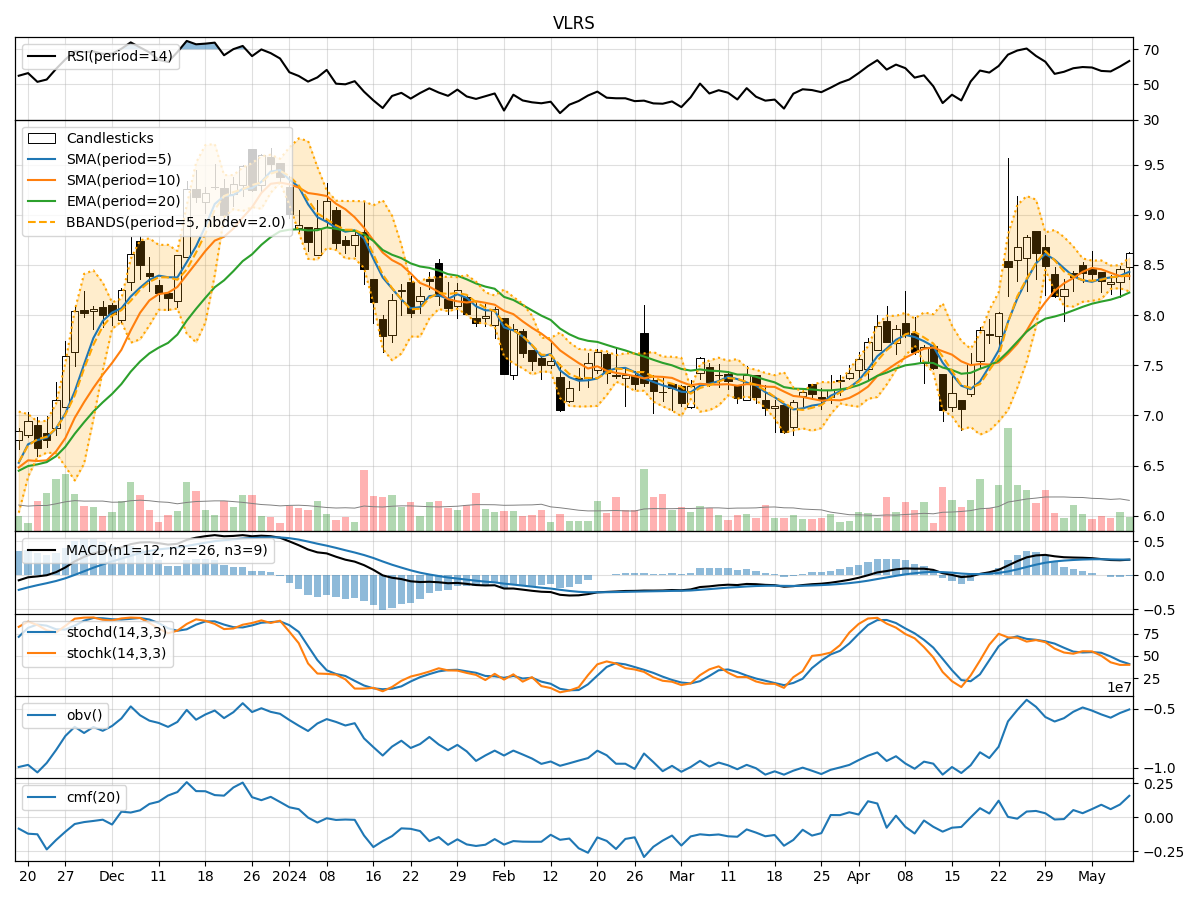
- Moving Averages (MA): The 5-day Moving Average (MA) has been fluctuating around the closing prices, indicating short-term price trends. The Simple Moving Average (SMA) and Exponential Moving Average (EMA) show a slight upward trend, suggesting potential bullish momentum.
- MACD: The Moving Average Convergence Divergence (MACD) has been positive but decreasing, indicating a potential slowdown in bullish momentum.
- MACD Histogram: The MACD Histogram has been decreasing, signaling a potential convergence towards a bearish crossover.
Momentum Indicators:
- RSI: The Relative Strength Index (RSI) has been fluctuating around the neutral zone, indicating indecision in the market.
- Stochastic Oscillator: Both %K and %D of the Stochastic Oscillator have been declining, suggesting a potential shift towards oversold conditions.
- Williams %R: The Williams %R has been hovering in the oversold territory, indicating a possible reversal in the short term.
Volatility Indicators:
- Bollinger Bands (BB): The Bollinger Bands have been widening, indicating increased volatility in the stock price.
- Bollinger %B: The Bollinger %B has been fluctuating around the middle band, suggesting a neutral stance in terms of volatility.
Volume Indicators:
- On-Balance Volume (OBV): The OBV has shown mixed movements, indicating uncertainty in the buying and selling pressure.
- Chaikin Money Flow (CMF): The CMF has been positive, suggesting potential accumulation in the stock.
Key Observations and Opinions:
- Trend: The trend indicators show a mixed picture with a slight bullish bias but with signs of potential weakness in momentum.
- Momentum: Momentum indicators suggest a possible shift towards oversold conditions, indicating a short-term bearish sentiment.
- Volatility: Volatility has been increasing, which could lead to larger price swings in the near future.
- Volume: Volume indicators reflect uncertainty in market participation, with no clear direction in buying or selling pressure.
Conclusion:
Based on the analysis of the technical indicators, the next few days for VLRS could see sideways consolidation with a slight bearish bias. Traders should exercise caution and closely monitor key support and resistance levels for potential entry or exit points. It is advisable to wait for more clarity in the market dynamics before making significant trading decisions.