Technical Analysis of VLN 2024-05-10
Overview:
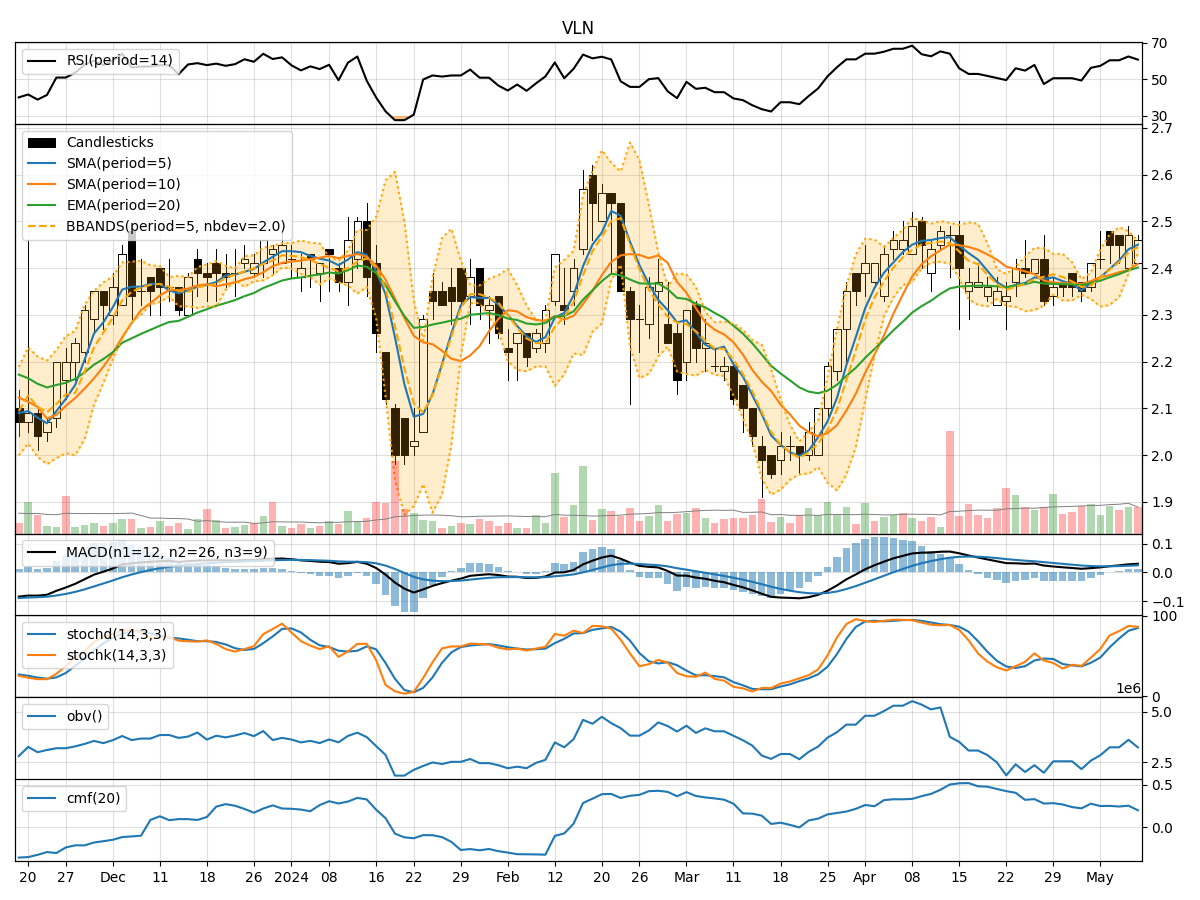
In analyzing the technical indicators for VLN over the last 5 days, we will delve into the trend, momentum, volatility, and volume indicators to provide a comprehensive outlook on the possible stock price movement. By examining these key aspects, we aim to offer valuable insights and predictions for the upcoming trading days.
Trend Analysis:
- Moving Averages (MA): The 5-day Moving Average (MA) has been steadily increasing, indicating a positive trend in the stock price.
- MACD: The MACD line has been consistently above the signal line, suggesting bullish momentum in the stock.
- Relative Strength Index (RSI): The RSI values have been in the range of 50-70, indicating a moderate bullish sentiment.
Momentum Analysis:
- Stochastic Oscillator: Both %K and %D values have been in the overbought territory, signaling a potential reversal or consolidation.
- Williams %R (WillR): The Williams %R values have been fluctuating around the oversold region, suggesting a mixed sentiment among traders.
Volatility Analysis:
- Bollinger Bands (BB): The stock price has been trading within the upper and lower bands, indicating a period of volatility and potential price expansion.
- Bollinger %B (BBP): The %B values have been fluctuating, reflecting the volatility in the stock price.
Volume Analysis:
- On-Balance Volume (OBV): The OBV has shown mixed movements, indicating indecision among investors regarding the stock.
- Chaikin Money Flow (CMF): The CMF values have been positive but fluctuating, suggesting a neutral to slightly bullish sentiment.
Key Observations:
- The stock is currently in an upward trend based on moving averages and MACD analysis.
- Momentum indicators show signs of overbought conditions, which could lead to a potential pullback or consolidation.
- Volatility has been present in the stock price, as indicated by the Bollinger Bands, suggesting potential price swings.
- Volume indicators reflect mixed investor sentiment, with no clear direction in trading activity.
Conclusion:
Based on the analysis of technical indicators, the next few days for VLN stock could see further upward movement in the price, supported by the positive trend and momentum. However, caution is advised due to the overbought conditions highlighted by the stochastic oscillator. Traders should closely monitor price movements within the Bollinger Bands for potential volatility spikes. Overall, the outlook leans towards a bullish bias but with a watchful eye on potential reversals or consolidations in the short term.