Technical Analysis of VIPS 2024-05-10
Overview:
In analyzing the technical indicators for VIPS over the last 5 days, we will delve into the trend, momentum, volatility, and volume indicators to provide a comprehensive outlook on the possible stock price movement in the coming days.
Trend Analysis:
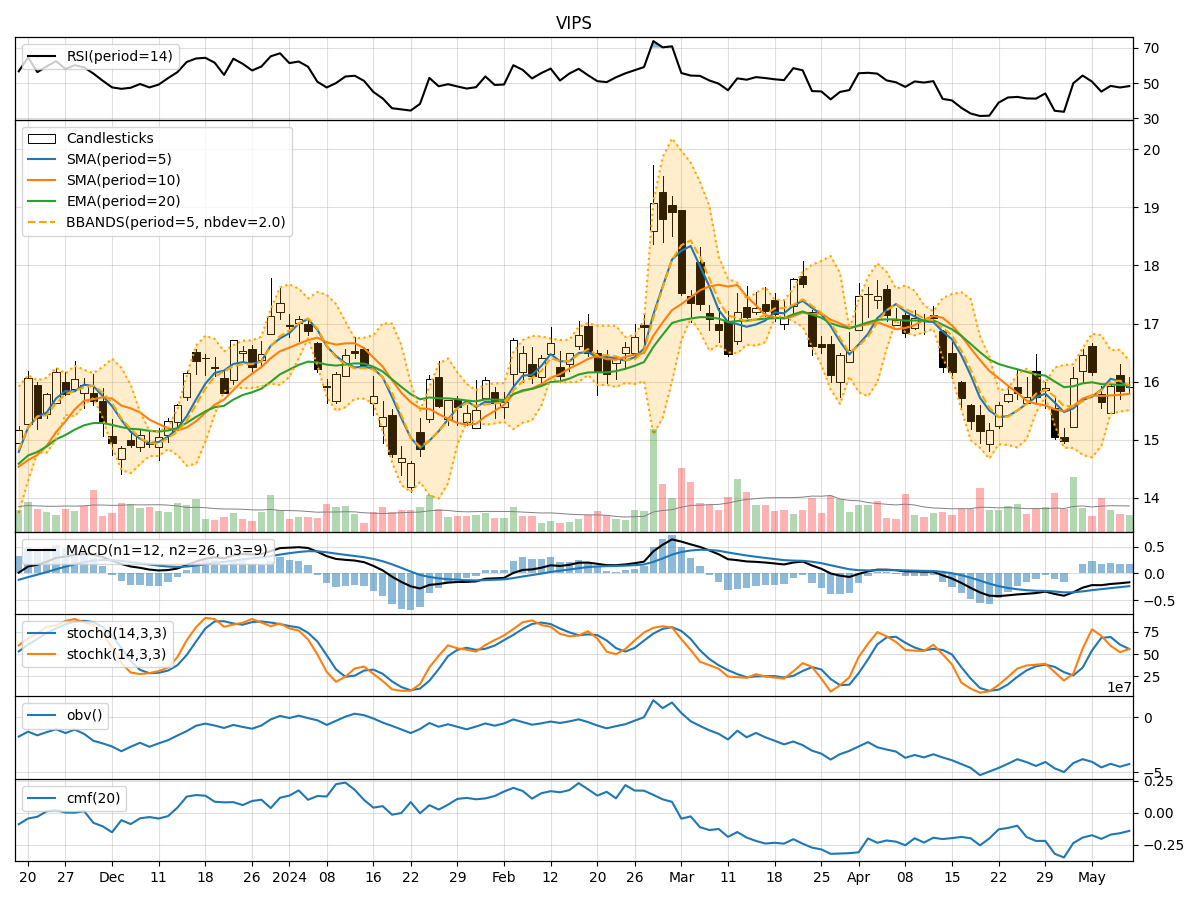
- Moving Averages (MA): The 5-day Moving Average (MA) has been fluctuating around the closing prices, indicating short-term price trends. The Simple Moving Average (SMA) and Exponential Moving Average (EMA) show a slight downward trend, with the EMA lagging behind.
- MACD: The Moving Average Convergence Divergence (MACD) has been negative, indicating a bearish trend. The MACD Histogram (MACDH) has been positive but decreasing, suggesting a potential reversal.
Momentum Analysis:
- RSI: The Relative Strength Index (RSI) has been hovering around the neutral 50 level, indicating a lack of strong momentum in either direction.
- Stochastic Oscillator: Both %K and %D have been fluctuating in the neutral zone, suggesting indecision in the market.
- Williams %R: The Williams %R shows oversold conditions but has not led to a significant price reversal.
Volatility Analysis:
- Bollinger Bands (BB): The Bollinger Bands have been narrowing, indicating decreasing volatility. The bands are squeezing around the price, signaling a potential breakout in either direction.
- Bollinger %B: The %B indicator shows the price nearing the lower band, suggesting a possible oversold condition.
Volume Analysis:
- On-Balance Volume (OBV): The OBV has been negative, indicating selling pressure in the market.
- Chaikin Money Flow (CMF): The CMF has been negative, reflecting a lack of buying interest.
Key Observations and Opinions:
- Trend: The trend indicators suggest a bearish bias, with the potential for a reversal as the MACDH decreases.
- Momentum: Momentum indicators show a lack of clear direction, indicating a period of consolidation.
- Volatility: Volatility has been decreasing, signaling a period of potential price consolidation before a breakout.
- Volume: The negative OBV and CMF indicate a bearish sentiment in the market.
Conclusion:
Based on the analysis of the technical indicators, the next few days for VIPS are likely to see sideways price movement with a potential for a bullish reversal. Traders should watch for a breakout from the tightening Bollinger Bands and monitor the MACDH for a possible trend reversal. It is essential to exercise caution and wait for confirmation signals before taking any significant trading positions.