Technical Analysis of VET 2024-05-10
Overview:
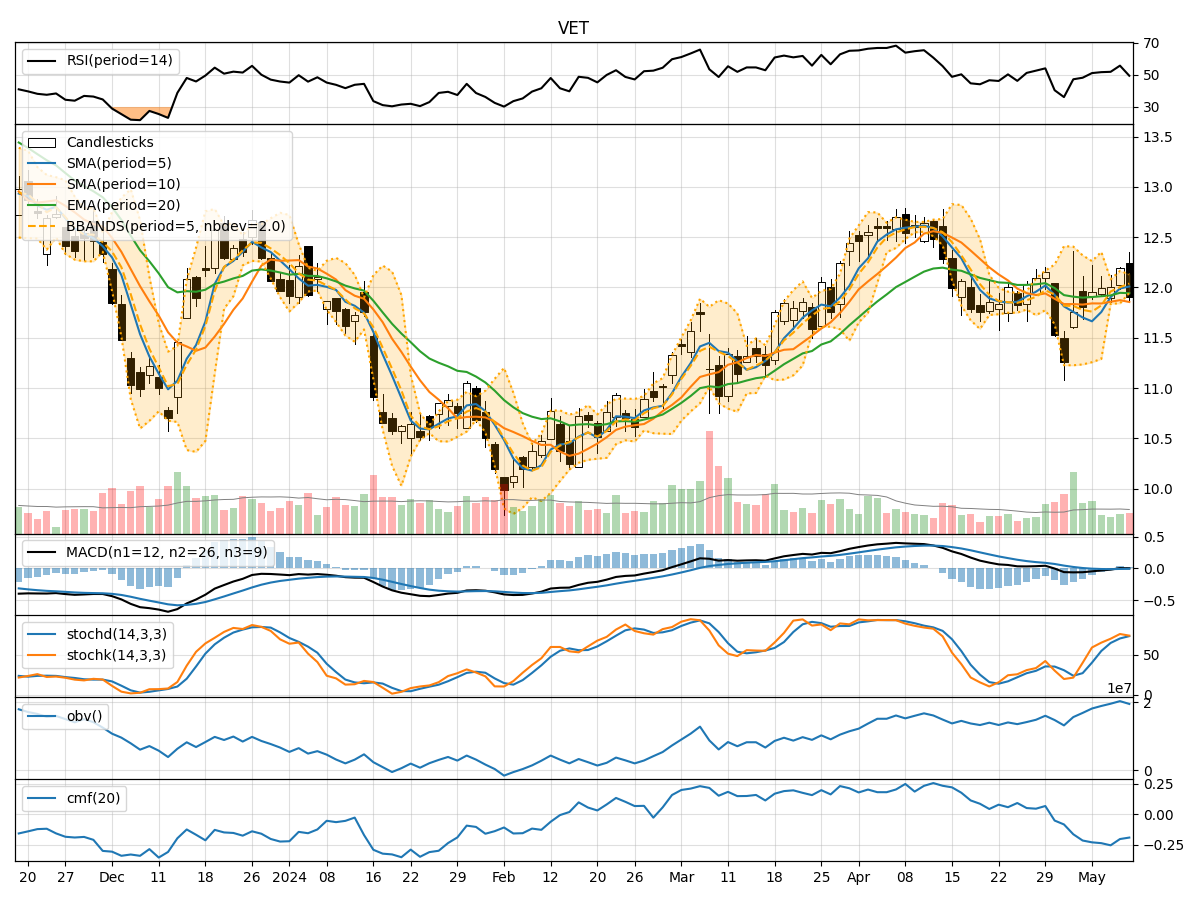
In analyzing the technical indicators for VET over the last 5 days, we will delve into the trend, momentum, volatility, and volume indicators to provide a comprehensive outlook on the possible stock price movement. By examining these key factors, we aim to offer valuable insights and predictions for the upcoming days.
Trend Analysis:
- Moving Averages (MA): The 5-day Moving Average (MA) has been showing an upward trend, indicating a positive momentum in the stock price.
- MACD: The Moving Average Convergence Divergence (MACD) has been fluctuating around the zero line, suggesting a lack of strong trend direction.
- RSI: The Relative Strength Index (RSI) has been hovering around the neutral zone, indicating a balanced buying and selling pressure.
Key Observation: The trend indicators suggest a mixed outlook with a slight bullish bias.
Momentum Analysis:
- Stochastic Oscillator: The Stochastic Oscillator has been in the overbought territory, signaling a potential reversal in the stock price.
- Williams %R: The Williams %R indicator has been in the oversold region, indicating a possible buying opportunity.
Key Observation: The momentum indicators point towards a potential reversal or correction in the stock price.
Volatility Analysis:
- Bollinger Bands: The Bollinger Bands have been narrowing, indicating decreasing volatility in the stock price.
- Volatility Percentage: The volatility percentage has been relatively low, suggesting a stable price movement.
Key Observation: The volatility indicators suggest a period of consolidation or sideways movement.
Volume Analysis:
- On-Balance Volume (OBV): The OBV has been fluctuating, indicating mixed buying and selling pressure.
- Chaikin Money Flow (CMF): The CMF has been negative, suggesting a net outflow of money from the stock.
Key Observation: The volume indicators reflect a lack of strong buying interest in the stock.
Conclusion:
Based on the analysis of the technical indicators, the next few days' possible stock price movement for VET is likely to be sideways or consolidation with a slight bullish bias. Traders should exercise caution and closely monitor key support and resistance levels for potential entry or exit points. It is advisable to wait for a clearer trend confirmation before making significant trading decisions.
Remember, market dynamics can change rapidly, so it is essential to stay updated with real-time data and adjust your strategy accordingly.