Technical Analysis of USB 2024-05-10
Overview:
In analyzing the technical indicators for USB stock over the last 5 days, we will delve into the trend, momentum, volatility, and volume indicators to provide a comprehensive assessment of the stock's potential price movement. By examining these key factors, we aim to offer valuable insights and predictions for the next few days.
Trend Analysis:
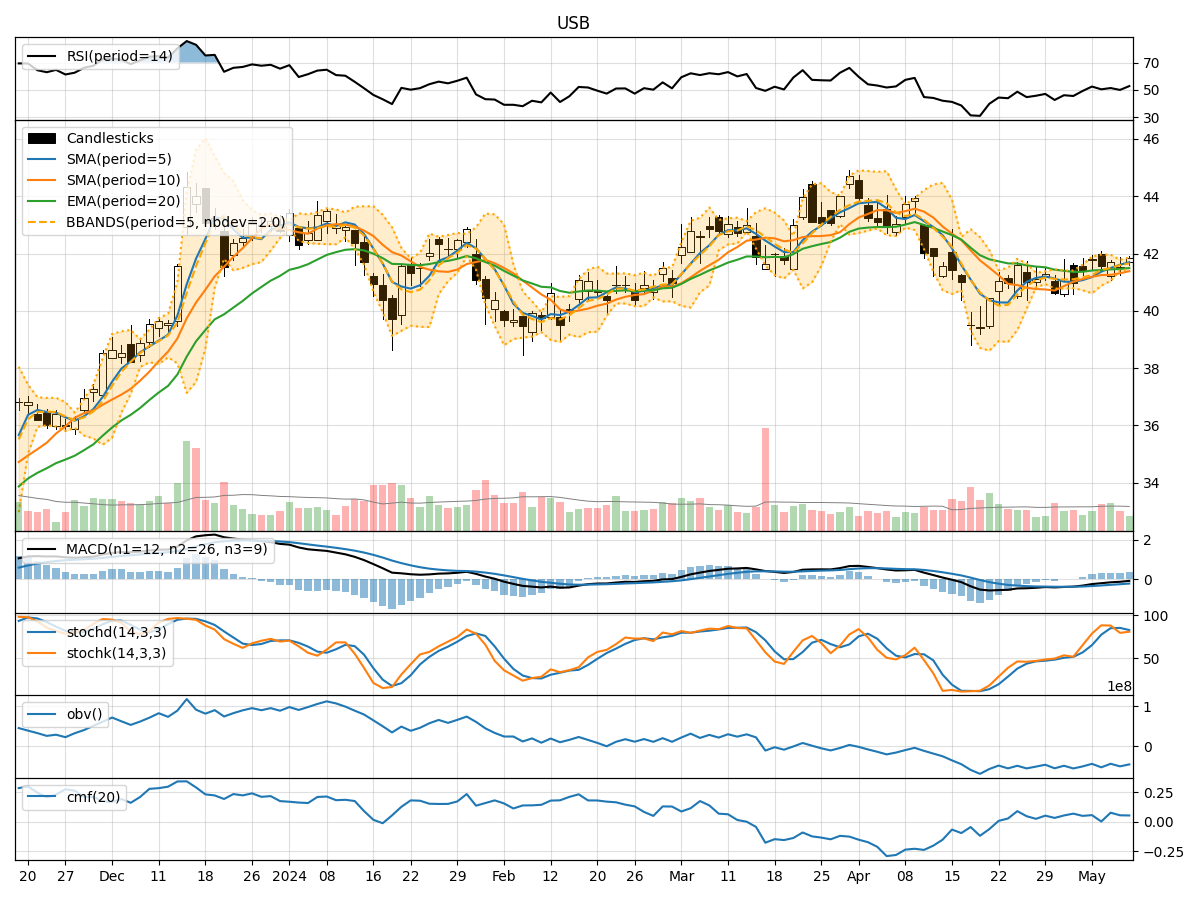
- Moving Averages (MA): The 5-day Moving Average (MA) has been trending slightly above the Simple Moving Average (SMA) and Exponential Moving Average (EMA) over the past 5 days, indicating a short-term bullish trend.
- MACD: The Moving Average Convergence Divergence (MACD) has been negative but showing signs of convergence towards the signal line, suggesting a potential reversal in the bearish momentum.
- Conclusion: The trend indicators point towards a potential reversal to the upside in the coming days.
Momentum Analysis:
- RSI: The Relative Strength Index (RSI) has been fluctuating around the neutral 50 level, indicating a lack of strong momentum in either direction.
- Stochastic Oscillator: Both %K and %D have been hovering in the overbought territory, suggesting a potential pullback in price.
- Conclusion: The momentum indicators suggest a sideways movement or a slight pullback in the near term.
Volatility Analysis:
- Bollinger Bands (BB): The Bollinger Bands have been relatively narrow, indicating low volatility in the stock price.
- Conclusion: The volatility indicators signal a period of consolidation or range-bound trading in the upcoming days.
Volume Analysis:
- On-Balance Volume (OBV): The OBV has shown mixed signals with fluctuations in volume, reflecting indecision among market participants.
- Chaikin Money Flow (CMF): The CMF has been positive but trending downwards, indicating a potential decrease in buying pressure.
- Conclusion: The volume indicators suggest uncertainty and a lack of clear direction in the market sentiment.
Overall Conclusion:
Based on the analysis of trend, momentum, volatility, and volume indicators, the next few days for USB stock are likely to see a sideways movement with a potential for a slight pullback. The trend indicators hint at a possible reversal to the upside, while momentum and volume indicators point towards indecision and lack of strong buying pressure. The low volatility suggests a period of consolidation, reinforcing the expectation of limited price movement.
Key Takeaways:
- Trend: Potential reversal to the upside.
- Momentum: Sideways movement or slight pullback.
- Volatility: Consolidation or range-bound trading.
- Volume: Uncertainty and lack of clear direction.
Recommendation:
Considering the mixed signals from the technical indicators, it is advisable for investors to exercise caution and closely monitor price action for any confirmation of a new trend. Traders may consider implementing tight risk management strategies to navigate the current market conditions effectively.