Technical Analysis of UNP 2024-05-10
Overview:
In analyzing the technical indicators for Union Pacific Corporation (UNP) over the last 5 days, we will delve into the trends, momentum, volatility, and volume indicators to provide insights into the possible future stock price movements. By examining these key indicators, we aim to offer a comprehensive analysis and make informed predictions for the upcoming days.
Trend Analysis:
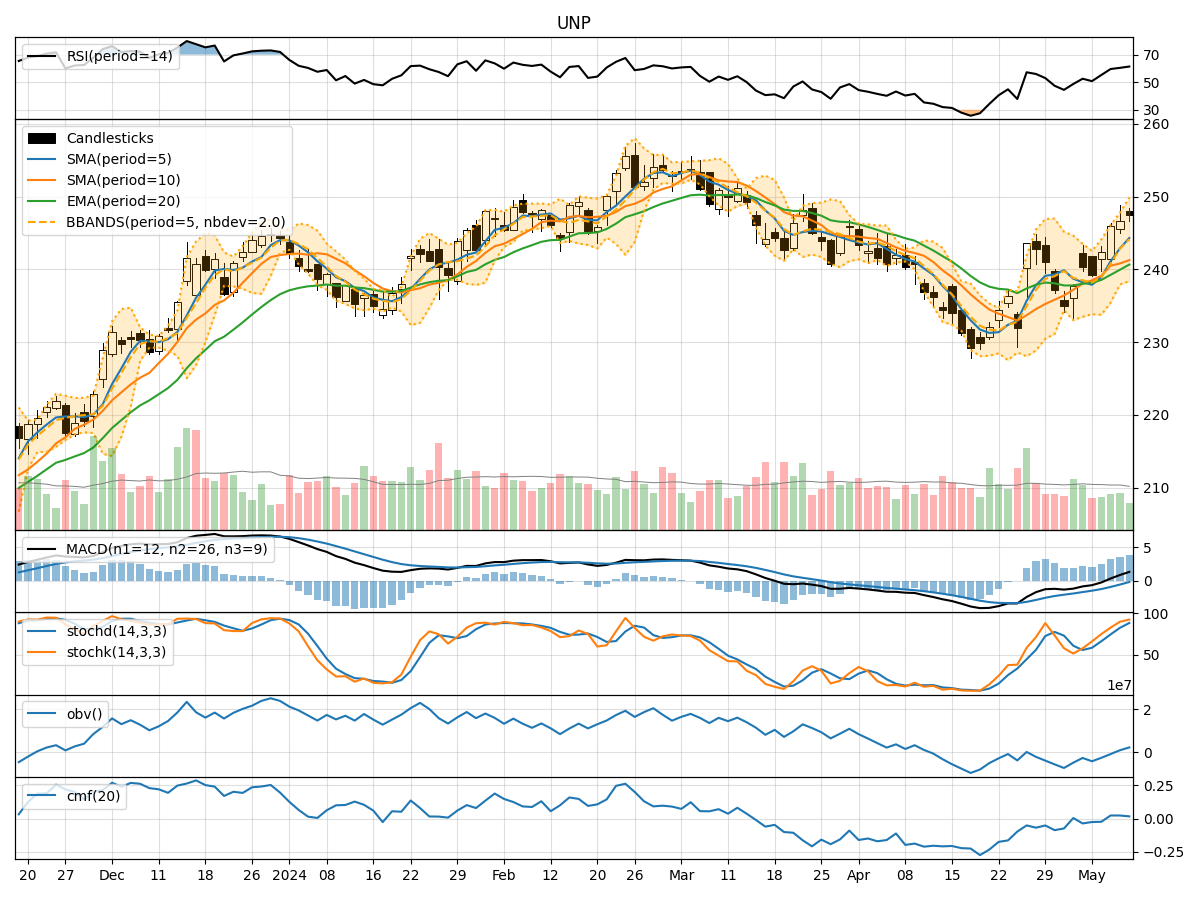
- Moving Averages (MA): The 5-day Moving Average (MA) has been consistently increasing, indicating a bullish trend in the short term.
- MACD (Moving Average Convergence Divergence): The MACD line has been above the signal line for the past 5 days, suggesting a bullish momentum.
- EMA (Exponential Moving Average): The EMA has also been on an upward trajectory, supporting the bullish trend.
Momentum Analysis:
- RSI (Relative Strength Index): The RSI has been gradually increasing and is currently in the neutral zone, indicating potential room for further upside.
- Stochastic Oscillator: Both %K and %D lines of the Stochastic Oscillator are in the overbought region, suggesting a strong bullish momentum.
- Williams %R (Willams Percentage Range): The Williams %R is in the oversold territory, indicating a potential reversal to the upside.
Volatility Analysis:
- Bollinger Bands (BB): The Bollinger Bands have been widening, indicating increased volatility in the stock price.
- BB% (Bollinger Bands Percentage): The BB% is relatively low, suggesting a potential breakout or significant price movement in the near future.
Volume Analysis:
- On-Balance Volume (OBV): The OBV has been declining over the past 5 days, indicating a decrease in buying pressure.
- Chaikin Money Flow (CMF): The CMF has been hovering around the zero line, reflecting a balance between buying and selling pressure.
Key Observations:
- The trend indicators suggest a strong bullish sentiment in the short term.
- Momentum indicators indicate a robust bullish momentum, but some oscillators are in overbought territory.
- Volatility has been increasing, potentially leading to significant price movements.
- Volume indicators show a decrease in buying pressure, which could impact future price movements.
Conclusion:
Based on the analysis of the technical indicators, the stock price of UNP is likely to continue its upward trajectory in the next few days. The bullish trend supported by moving averages and MACD, coupled with the positive momentum indicated by RSI and Stochastic Oscillator, suggests further upside potential. However, traders should be cautious of the overbought signals in some momentum indicators and the decreasing buying pressure reflected in volume indicators. Overall, the outlook for UNP appears bullish in the short term, with the possibility of increased volatility and potential price breakouts.