Technical Analysis of UL 2024-05-10
Overview:
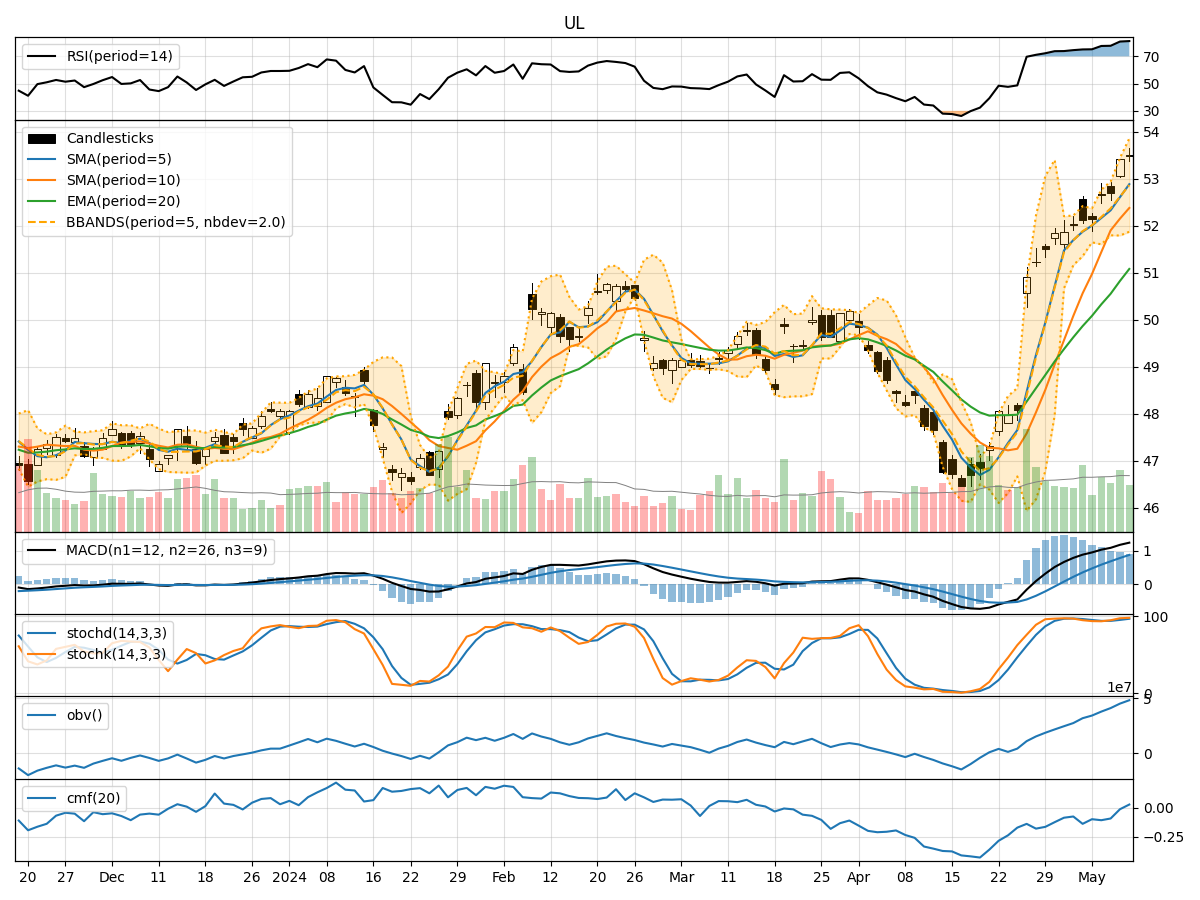
In the last 5 trading days, UL stock has shown a consistent uptrend in both price and volume. The trend indicators such as Moving Averages (MA), MACD, and RSI all suggest a bullish sentiment. Momentum indicators like Stochastic Oscillator and Williams %R also indicate strong buying momentum. Volatility indicators show expanding Bollinger Bands, indicating increased price volatility. Volume indicators like On-Balance Volume (OBV) and Chaikin Money Flow (CMF) suggest accumulation of the stock.
Trend Analysis:
- Moving Averages (MA): The 5-day MA has been consistently above the 10-day SMA, indicating a short-term bullish trend.
- MACD: The MACD line has been above the signal line, showing a bullish trend.
- RSI: The RSI has been consistently above 70, indicating an overbought condition but also strong bullish momentum.
Momentum Analysis:
- Stochastic Oscillator: Both %K and %D lines are in the overbought zone, suggesting a strong buying momentum.
- Williams %R: The indicator is in the oversold territory, indicating a potential reversal to the upside.
Volatility Analysis:
- Bollinger Bands: The widening of the Bollinger Bands suggests increasing volatility in the stock price.
- Bollinger %B: The %B indicator is below 1, indicating that the stock price is trading below the upper Bollinger Band.
Volume Analysis:
- On-Balance Volume (OBV): The OBV has been steadily increasing, indicating strong buying pressure.
- Chaikin Money Flow (CMF): The CMF is negative but trending upwards, suggesting accumulation.
Key Observations:
- The stock is in a strong uptrend based on trend and momentum indicators.
- Volatility is increasing, which could lead to larger price swings.
- Volume indicators show accumulation, supporting the bullish bias.
Conclusion:
Based on the technical analysis of UL stock: - Overall View: The stock is bullish in the short term. - Price Movement: The next few days are likely to see upward movement in the stock price. - Recommendation: Consider buying or holding positions in UL stock for potential gains. - Risk Management: Keep an eye on overbought conditions and increasing volatility for proper risk management.
In conclusion, the technical indicators suggest a continuation of the bullish trend in UL stock. Traders and investors should monitor key levels and indicators for potential entry or exit points.