Technical Analysis of UHS 2024-05-10
Overview:
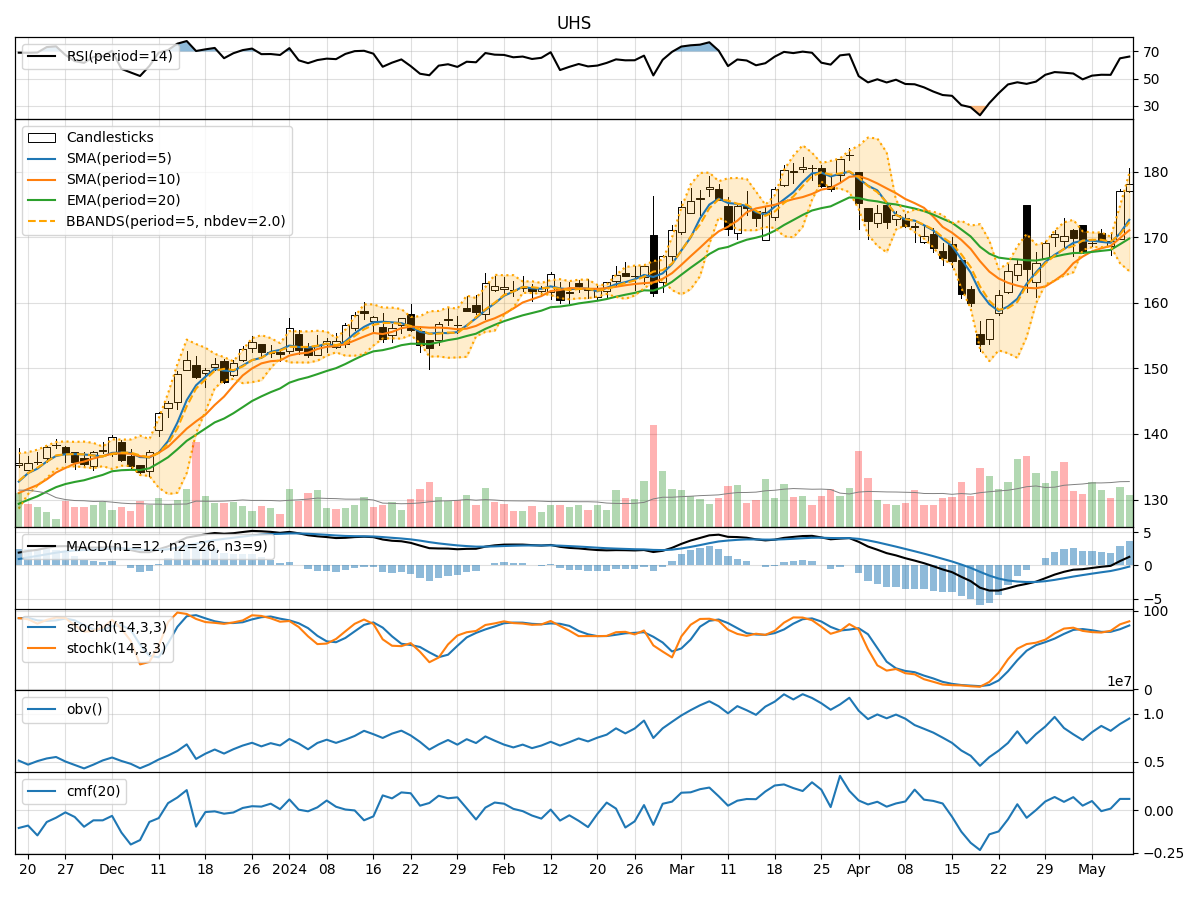
In analyzing the technical indicators for UHS over the last 5 days, we will delve into the trend, momentum, volatility, and volume indicators to provide a comprehensive outlook on the possible stock price movement in the coming days.
Trend Analysis:
- Moving Averages (MA): The 5-day Moving Average (MA) has been trending upwards, indicating a positive momentum in the stock price.
- MACD: The MACD line has been consistently above the signal line, suggesting a bullish trend in the stock.
- EMA: The Exponential Moving Average (EMA) has been steadily increasing, further supporting the bullish sentiment in the stock.
Momentum Analysis:
- RSI: The Relative Strength Index (RSI) has been in the neutral zone, indicating neither overbought nor oversold conditions.
- Stochastic Oscillator: Both %K and %D have been in the overbought territory, signaling a potential reversal or consolidation.
- Williams %R: The Williams %R is in the oversold region, suggesting a possible buying opportunity.
Volatility Analysis:
- Bollinger Bands: The Bollinger Bands have widened, indicating increased volatility in the stock price.
- Bollinger %B: The %B indicator is below 1, suggesting the stock is trading below the lower Bollinger Band, potentially indicating an oversold condition.
Volume Analysis:
- On-Balance Volume (OBV): The OBV has been trending upwards, indicating accumulation of the stock by investors.
- Chaikin Money Flow (CMF): The CMF is positive, suggesting money flow into the stock over the past 20 days.
Key Observations:
- The trend indicators suggest a bullish sentiment in the stock, supported by moving averages and MACD.
- Momentum indicators show mixed signals with RSI in a neutral zone and Stochastic Oscillator indicating potential reversal.
- Volatility has increased, as seen in the widening Bollinger Bands, which could lead to larger price swings.
- Volume indicators point towards accumulation of the stock by investors, supported by positive OBV and CMF.
Conclusion:
Based on the analysis of the technical indicators, the stock price of UHS is likely to experience further upward movement in the coming days. The bullish trend indicated by moving averages and MACD, coupled with positive volume indicators, suggests a potential continuation of the current uptrend. However, caution is advised due to mixed signals from momentum indicators, indicating a possible consolidation or minor pullback before resuming the upward trajectory. Investors should closely monitor the Stochastic Oscillator for potential reversal signals and consider the increased volatility in their trading strategy.