Technical Analysis of TXT 2024-05-10
Overview:
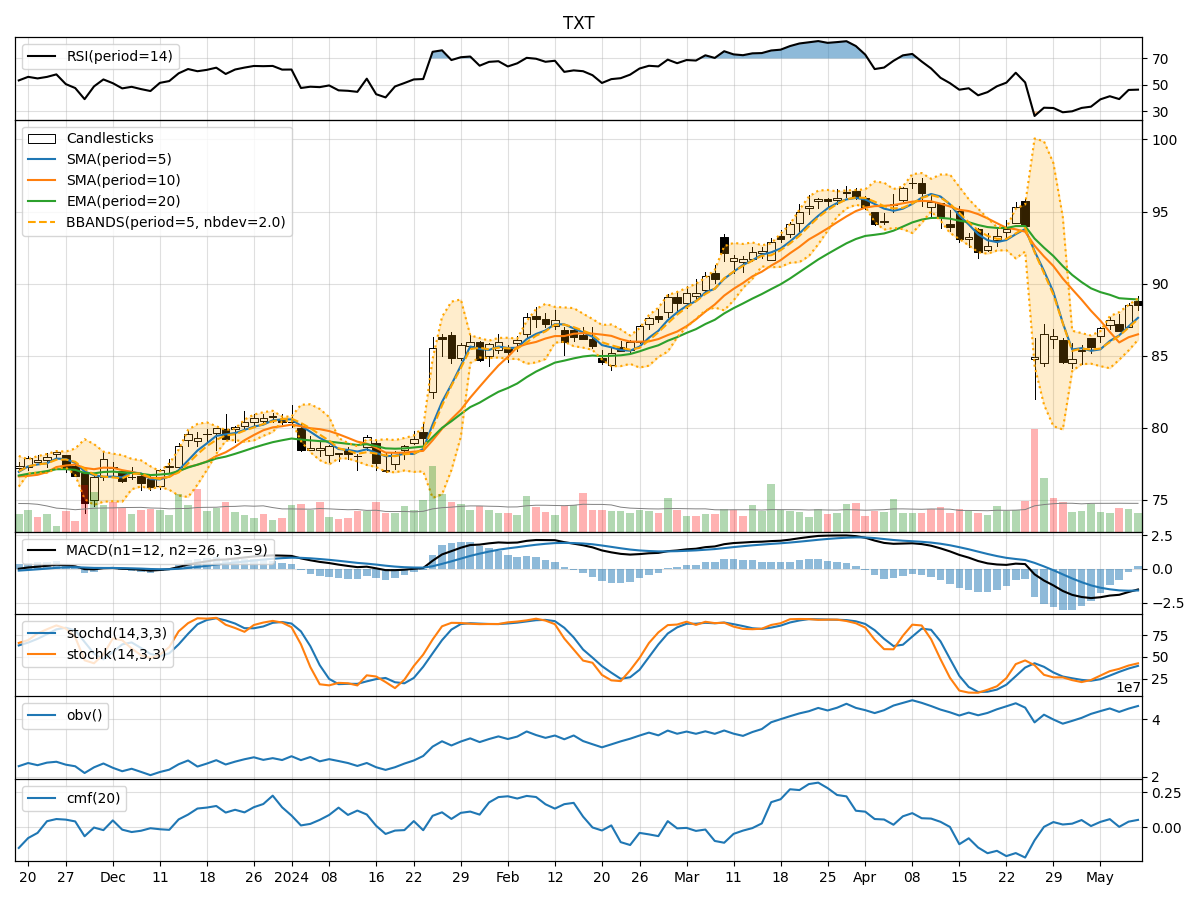
In analyzing the technical indicators for TXT over the last 5 days, we will delve into the trend, momentum, volatility, and volume indicators to provide a comprehensive outlook on the possible stock price movement in the coming days. By examining these key indicators, we aim to offer valuable insights and predictions for informed decision-making.
Trend Analysis:
- Moving Averages (MA): The 5-day moving average has been consistently above the closing prices, indicating a potential uptrend.
- MACD: The MACD line has been negative but showing signs of convergence towards the signal line, suggesting a possible trend reversal.
- EMA: The exponential moving average has been declining, reflecting recent price weakness.
Momentum Analysis:
- RSI: The RSI has been fluctuating in the neutral zone, indicating indecision among traders.
- Stochastic Oscillator: Both %K and %D have been rising, signaling increasing buying momentum.
- Williams %R: The indicator has been hovering in the oversold territory, suggesting a potential buying opportunity.
Volatility Analysis:
- Bollinger Bands: The stock price has been trading within the bands, indicating normal volatility.
- Bollinger %B: The %B indicator has been fluctuating around the midline, reflecting a balanced market sentiment.
Volume Analysis:
- On-Balance Volume (OBV): The OBV has been trending upwards, suggesting accumulation by investors.
- Chaikin Money Flow (CMF): The CMF has been positive, indicating buying pressure in the stock.
Key Observations:
- The trend indicators show a mixed picture with a potential reversal in the MACD.
- Momentum indicators suggest a slight bullish bias with increasing buying momentum.
- Volatility remains stable, indicating no significant price fluctuations.
- Volume indicators point towards accumulation and positive buying pressure.
Conclusion:
Based on the analysis of the technical indicators, the next few days for TXT stock price movement are likely to be upward with a bullish bias. The convergence in the MACD, increasing buying momentum in the stochastic oscillator, and positive OBV and CMF readings indicate a potential uptrend. Traders and investors may consider taking long positions or holding onto existing positions to benefit from the expected price appreciation. However, it is essential to monitor the indicators closely for any signs of reversal or trend weakness.