Technical Analysis of TX 2024-05-10
Overview:
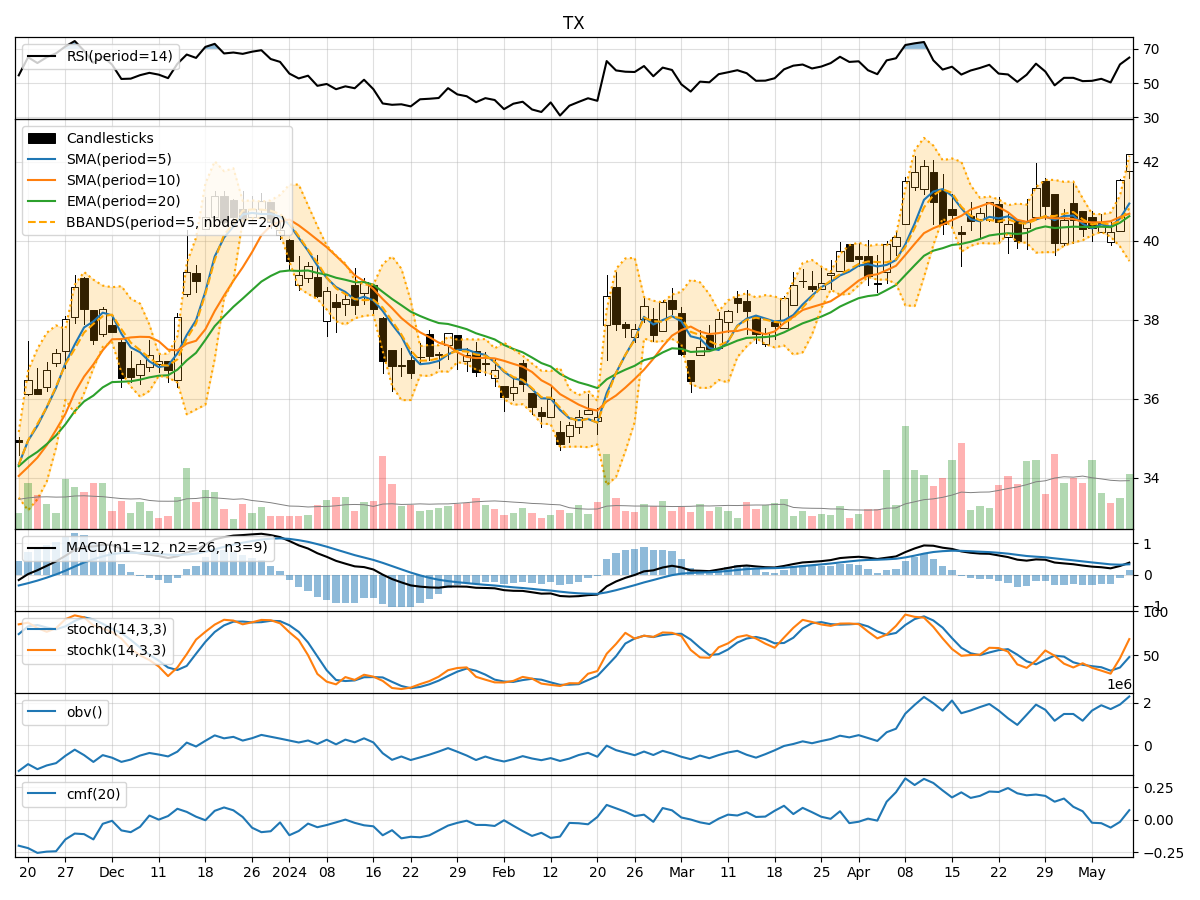
In the last 5 trading days, TX stock has shown mixed signals across various technical indicators. The stock price has experienced fluctuations, with some indicators suggesting potential bullish momentum while others indicating a more neutral or bearish outlook. To provide a comprehensive analysis, we will delve into the trend, momentum, volatility, and volume indicators to determine the possible future stock price movement for the next few days.
Trend Indicators:
- Moving Averages (MA): The 5-day MA has been fluctuating around the closing prices, indicating a lack of clear trend direction.
- MACD: The MACD line has shown a slight positive trend, with the MACD histogram moving towards the zero line.
- RSI: The RSI values have been hovering around the mid-level, suggesting a neutral stance in terms of momentum.
Momentum Indicators:
- Stochastic Oscillator: The Stochastic indicators have shown mixed signals, with the %K values fluctuating and the %D values indicating potential reversal points.
- Williams %R: The Williams %R values have been fluctuating, indicating indecision in the market sentiment.
Volatility Indicators:
- Bollinger Bands: The Bollinger Bands have widened, indicating increased volatility in the stock price.
- BB% (Bollinger Band %B): The BB% values have fluctuated, suggesting potential overbought or oversold conditions.
Volume Indicators:
- On-Balance Volume (OBV): The OBV values have shown slight increases, indicating some accumulation in the stock.
- Chaikin Money Flow (CMF): The CMF values have been negative, suggesting potential selling pressure.
Key Observations:
- The trend indicators show a lack of clear direction in the stock price movement.
- Momentum indicators indicate mixed signals, with no strong bullish or bearish momentum.
- Volatility has increased, suggesting potential price swings in the near term.
- Volume indicators show some accumulation but with negative CMF values, indicating selling pressure.
Conclusion:
Based on the analysis of the technical indicators, the next few days' stock price movement for TX is likely to be sideways with a slightly bearish bias. The lack of clear trend direction, mixed momentum signals, increased volatility, and negative CMF values suggest that the stock may consolidate or experience minor downward movements in the short term. Traders should exercise caution and closely monitor key support and resistance levels for potential entry or exit points.