Technical Analysis of TSN 2024-05-10
Overview:
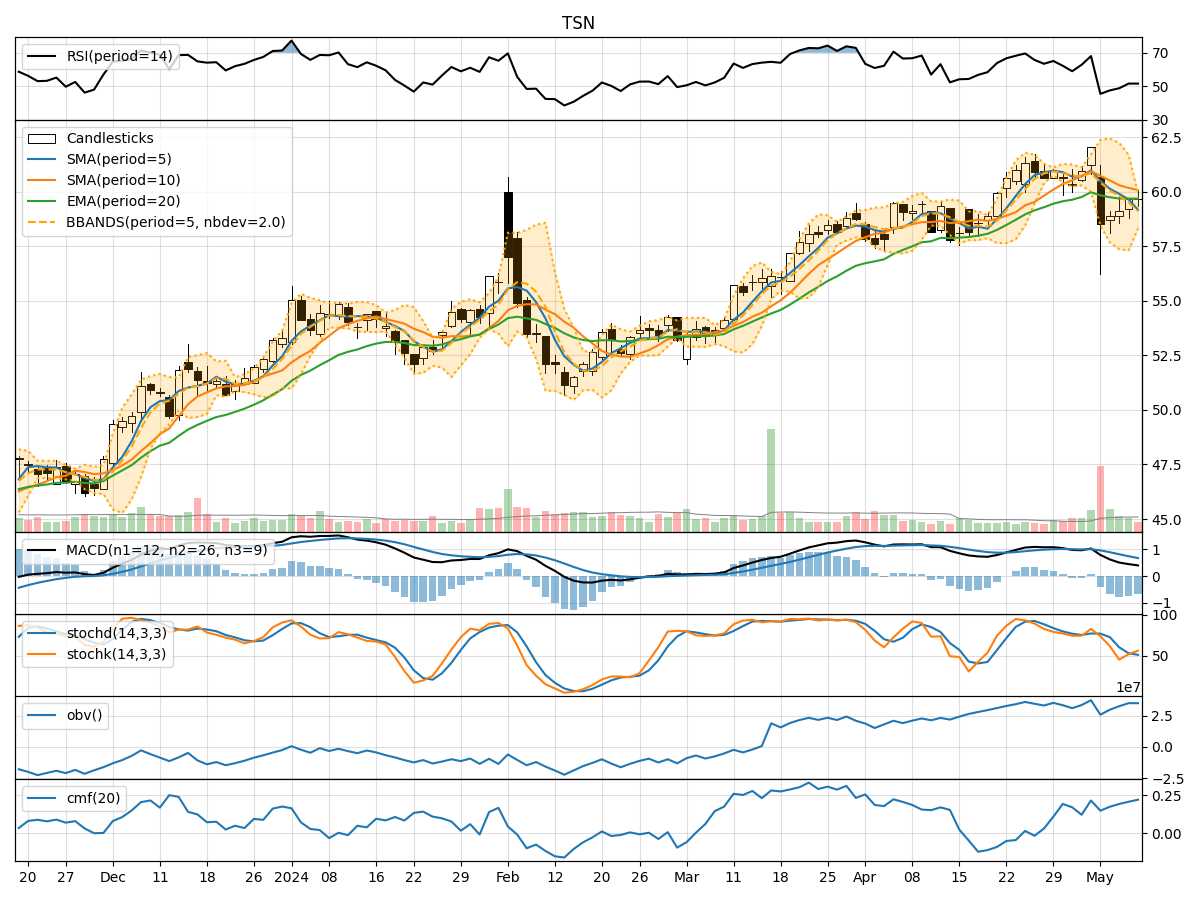
In analyzing the technical indicators for TSN over the last 5 days, we will delve into the trend, momentum, volatility, and volume indicators to provide a comprehensive outlook on the possible stock price movement in the coming days.
Trend Analysis:
- Moving Averages (MA): The 5-day Moving Average (MA) has been consistently below the Simple Moving Average (SMA) and Exponential Moving Average (EMA) over the past 5 days, indicating a downward trend.
- MACD: The MACD line has been below the signal line, with the MACD Histogram showing negative values, suggesting a bearish trend.
Momentum Analysis:
- RSI: The Relative Strength Index (RSI) has been gradually increasing but remains below the overbought threshold of 70, indicating a potential for further upward movement.
- Stochastic Oscillator: Both %K and %D have been rising, but %K is still below %D, suggesting a potential reversal to the upside.
- Williams %R: The Williams %R is in the oversold territory, indicating a possible buying opportunity.
Volatility Analysis:
- Bollinger Bands (BB): The stock price has been trading within the lower Bollinger Band, indicating a potential oversold condition.
- Bollinger %B: The %B value is below 1, suggesting that the stock price is trading below the lower Bollinger Band, indicating a possible reversal to the upside.
Volume Analysis:
- On-Balance Volume (OBV): The OBV has been increasing over the past 5 days, indicating accumulation by investors.
- Chaikin Money Flow (CMF): The CMF has been on an upward trend, indicating buying pressure in the stock.
Conclusion:
Based on the analysis of the technical indicators, the stock price of TSN is likely to experience a short-term upward movement in the coming days. The momentum indicators suggest a potential reversal to the upside, supported by the increasing RSI and Stochastic %K and %D. The volatility indicators, such as the Bollinger Bands and %B, also point towards a possible reversal from the oversold condition. Additionally, the increasing OBV and CMF indicate buying pressure in the stock.
Recommendation:
Considering the overall technical analysis, it is advisable to consider buying TSN in the short term as the indicators align towards a potential upward movement. However, it is essential to monitor the price action closely and set appropriate stop-loss levels to manage risk effectively.