Technical Analysis of TRV 2024-05-10
Overview:
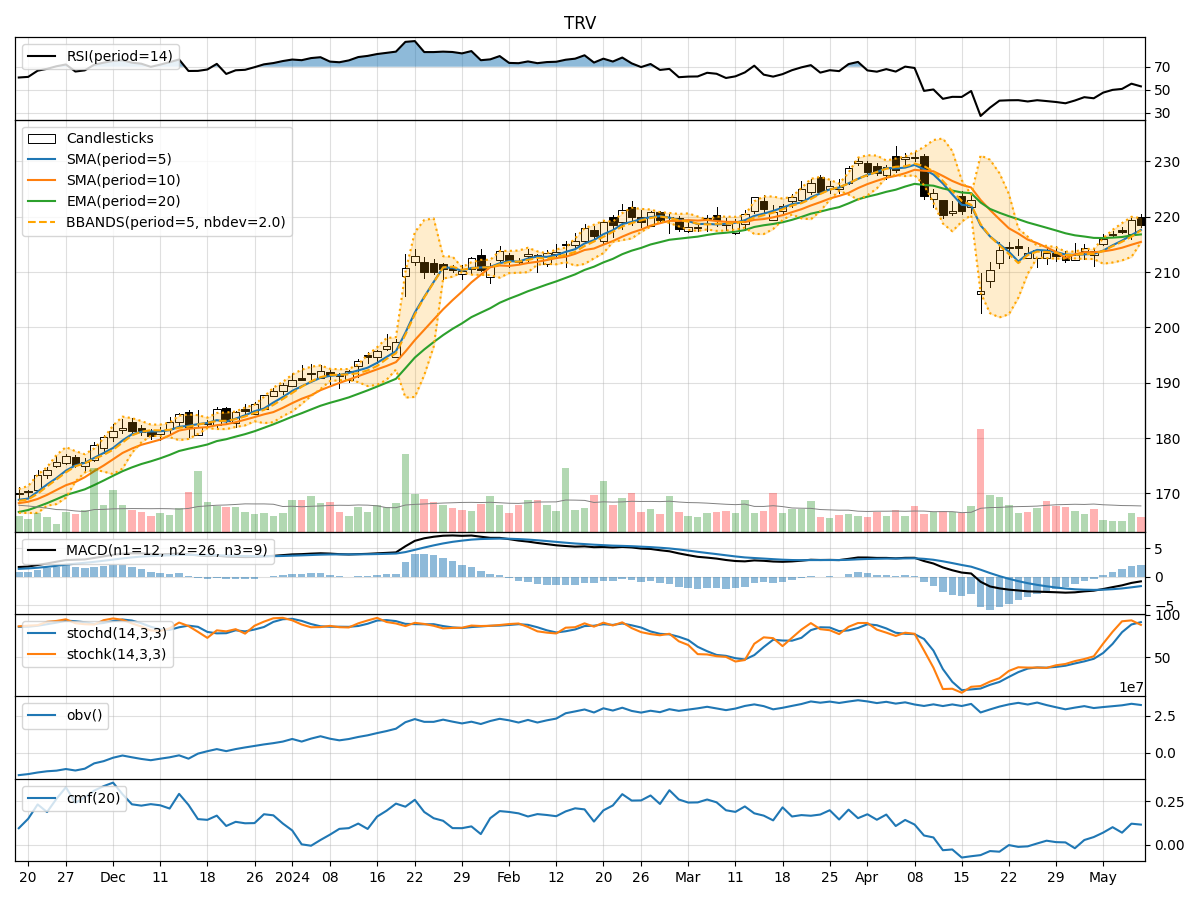
In analyzing the technical indicators for TRV over the last 5 days, we will delve into the trend, momentum, volatility, and volume indicators to provide a comprehensive outlook on the possible stock price movement in the coming days. By examining these key aspects, we aim to offer valuable insights and predictions for potential investors.
Trend Analysis:
- Moving Averages (MA): The 5-day Moving Average (MA) has been consistently rising, indicating a bullish trend in the short term.
- MACD: The MACD line has been positive and increasing, suggesting upward momentum in the stock price.
- RSI: The Relative Strength Index (RSI) has been fluctuating around the neutral zone, indicating a balanced momentum.
Momentum Analysis:
- Stochastic Oscillator: Both %K and %D have been in the overbought territory, signaling a potential reversal or consolidation.
- Williams %R: The Williams %R is in the oversold region, indicating a possible buying opportunity.
Volatility Analysis:
- Bollinger Bands (BB): The stock price has been trading within the Bollinger Bands, suggesting a period of consolidation.
- BB%: The %B indicator is below 1, indicating the price is below the upper band and potentially oversold.
Volume Analysis:
- On-Balance Volume (OBV): The OBV has been fluctuating, indicating mixed sentiment among investors.
- Chaikin Money Flow (CMF): The CMF has been positive, suggesting money flow into the stock.
Key Observations:
- The trend indicators show a bullish sentiment in the short term.
- Momentum indicators suggest a potential reversal or consolidation in the near future.
- Volatility indicators point towards a period of consolidation.
- Volume indicators reflect mixed sentiment among investors.
Conclusion:
Based on the analysis of the technical indicators, the next few days for TRV stock price movement could be sideways with a slight bearish bias. Investors should closely monitor the stochastic oscillator for potential reversal signals and the Bollinger Bands for any breakout or breakdown patterns. It is advisable to exercise caution and wait for clearer signals before making significant trading decisions.