Technical Analysis of TRP 2024-05-10
Overview:
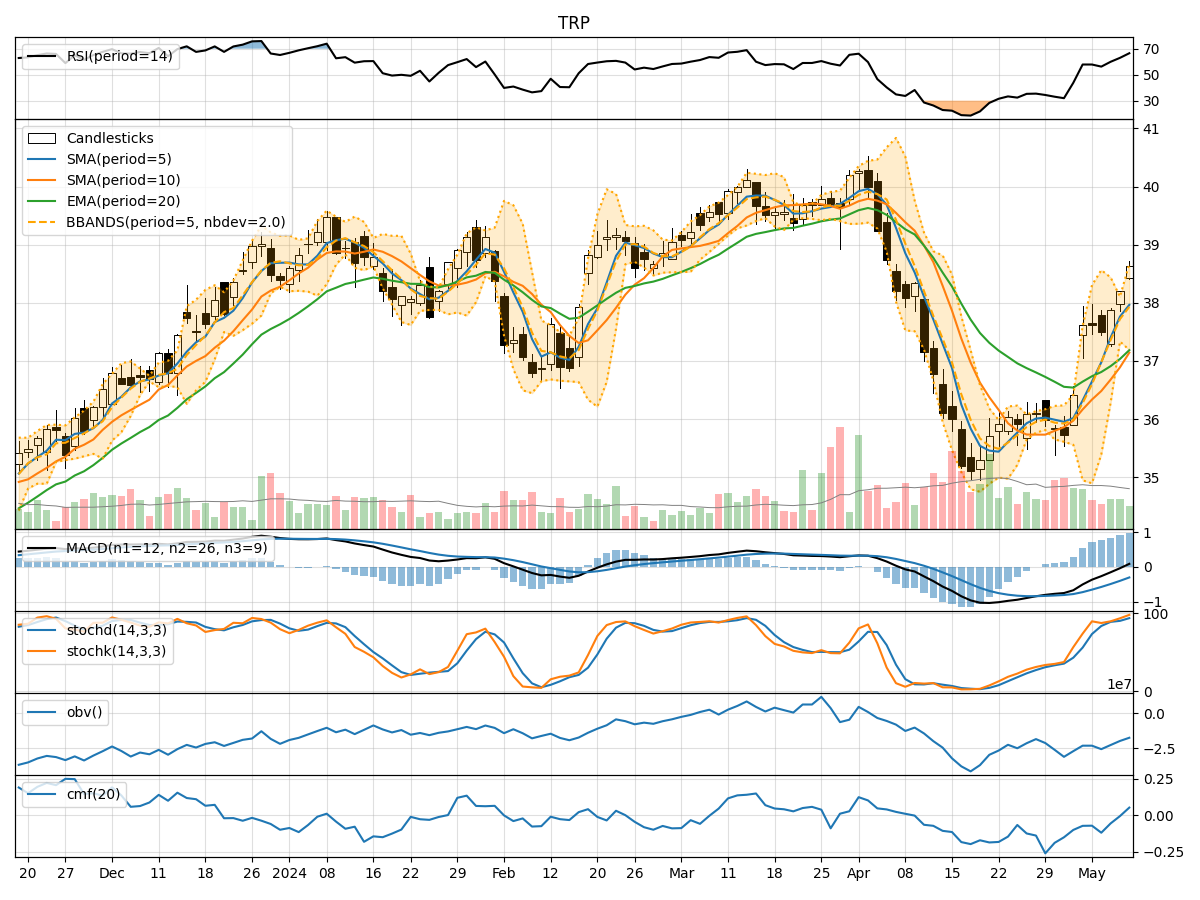
In analyzing the technical indicators for TRP over the last 5 days, we will delve into the trend, momentum, volatility, and volume indicators to provide a comprehensive outlook on the possible stock price movement in the coming days.
Trend Indicators:
- Moving Averages (MA): The 5-day MA has been consistently rising, indicating a bullish trend.
- MACD: The MACD line has been above the signal line, suggesting a bullish momentum.
- EMA: The EMA has been trending upwards, supporting the bullish sentiment.
Momentum Indicators:
- RSI: The RSI has been increasing, showing strengthening buying momentum.
- Stochastic Oscillator: Both %K and %D have been in the overbought zone, indicating a strong bullish momentum.
- Williams %R: The indicator has been in the oversold region, suggesting a potential reversal.
Volatility Indicators:
- Bollinger Bands: The bands have been widening, indicating increased volatility.
- Bollinger %B: The %B has been fluctuating within a range, reflecting the volatility in the stock.
Volume Indicators:
- On-Balance Volume (OBV): The OBV has shown mixed signals, with some days seeing selling pressure and others showing accumulation.
- Chaikin Money Flow (CMF): The CMF has been negative, indicating some distribution in the stock.
Key Observations:
- The trend indicators suggest a strong bullish sentiment with moving averages and MACD supporting an upward trend.
- Momentum indicators like RSI and Stochastic Oscillator indicate a strong buying momentum, although Williams %R suggests a potential reversal.
- Volatility has been increasing, as seen in the widening Bollinger Bands, which could lead to larger price swings.
- Volume indicators show mixed signals with OBV indicating both buying and selling pressure, while CMF leans towards distribution.
Conclusion:
Based on the analysis of the technical indicators, the stock price of TRP is likely to continue its upward trajectory in the next few days. The bullish trend supported by moving averages and MACD, coupled with strong buying momentum from RSI and Stochastic Oscillator, indicates a positive outlook. However, caution is advised due to the potential reversal signal from Williams %R and the increasing volatility as shown by Bollinger Bands. Monitoring volume closely for confirmation of buying pressure is recommended to validate the bullish bias.