Technical Analysis of TRI 2024-05-10
Overview:
In analyzing the technical indicators for TRI over the last 5 days, we will delve into the trend, momentum, volatility, and volume indicators to provide a comprehensive outlook on the possible stock price movement in the coming days.
Trend Analysis:
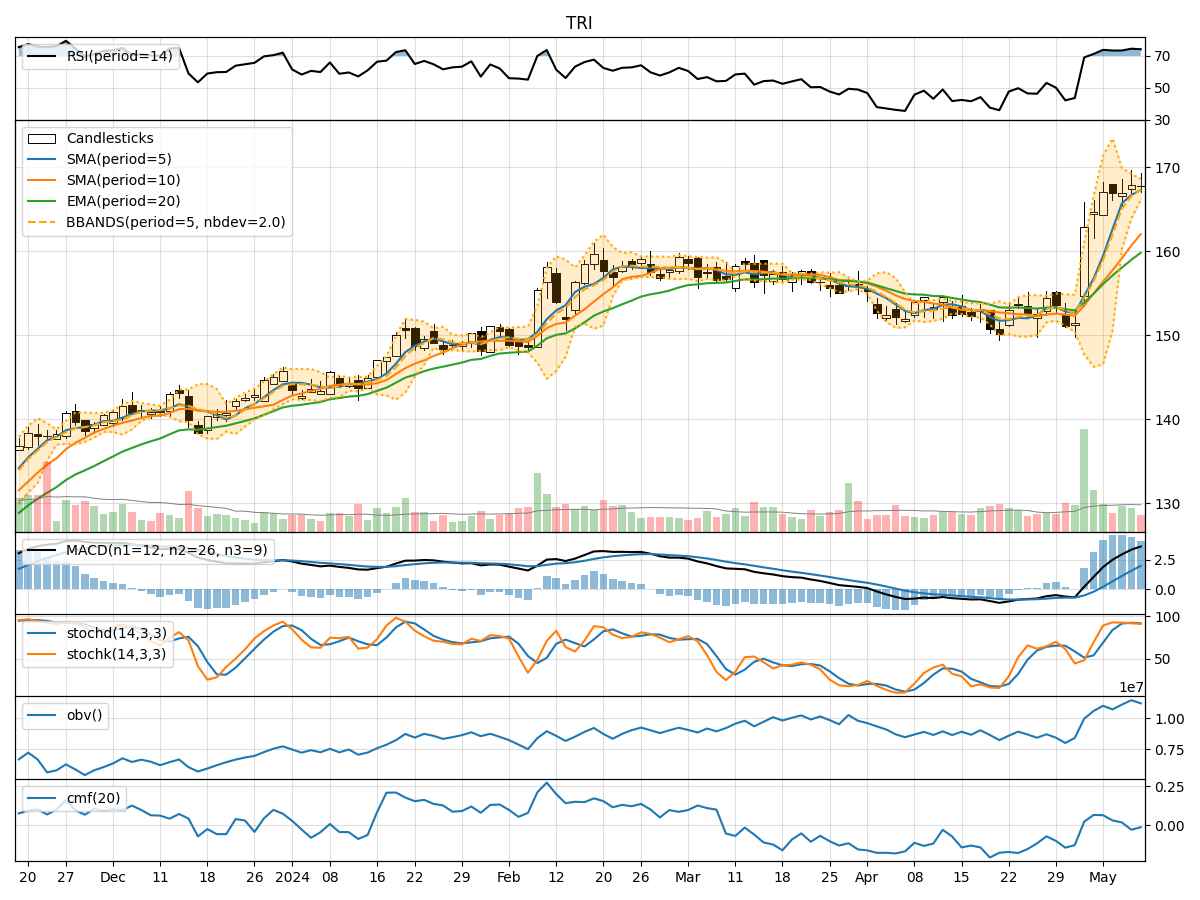
- Moving Averages (MA): The 5-day Moving Average (MA) has been consistently above the Simple Moving Average (SMA) and Exponential Moving Average (EMA), indicating a bullish trend.
- MACD: The MACD line has been consistently above the signal line, with increasing values, suggesting strong bullish momentum.
- RSI: The Relative Strength Index (RSI) has been in the overbought territory, indicating a strong bullish sentiment.
Momentum Analysis:
- Stochastic Oscillator: Both %K and %D have been in the overbought zone, signaling a potential reversal or consolidation.
- Williams %R: The Williams %R is in the oversold region, suggesting a possible reversal in the short term.
Volatility Analysis:
- Bollinger Bands (BB): The stock price has been trading within the upper Bollinger Band, indicating an overbought condition.
- Bollinger %B: The %B indicator is above 0.5, suggesting a bullish trend.
Volume Analysis:
- On-Balance Volume (OBV): The OBV has been fluctuating, indicating indecision among investors.
- Chaikin Money Flow (CMF): The CMF has been positive but decreasing, signaling potential profit-taking.
Key Observations:
- The trend indicators suggest a strong bullish sentiment in the short term.
- Momentum indicators show signs of potential reversal or consolidation.
- Volatility indicators point towards an overbought condition.
- Volume indicators reflect indecision among investors.
Conclusion:
Based on the analysis of the technical indicators, the next few days' possible stock price movement for TRI is likely to experience a short-term consolidation or pullback. The stock has been in overbought territory, and the momentum indicators suggest a potential reversal. Investors should exercise caution and consider taking profits or waiting for a better entry point before initiating new positions.