Technical Analysis of TNK 2024-05-10
Overview:
In analyzing the technical indicators for TNK over the last 5 days, we will delve into the trend, momentum, volatility, and volume indicators to provide a comprehensive outlook on the possible stock price movement in the coming days.
Trend Analysis:
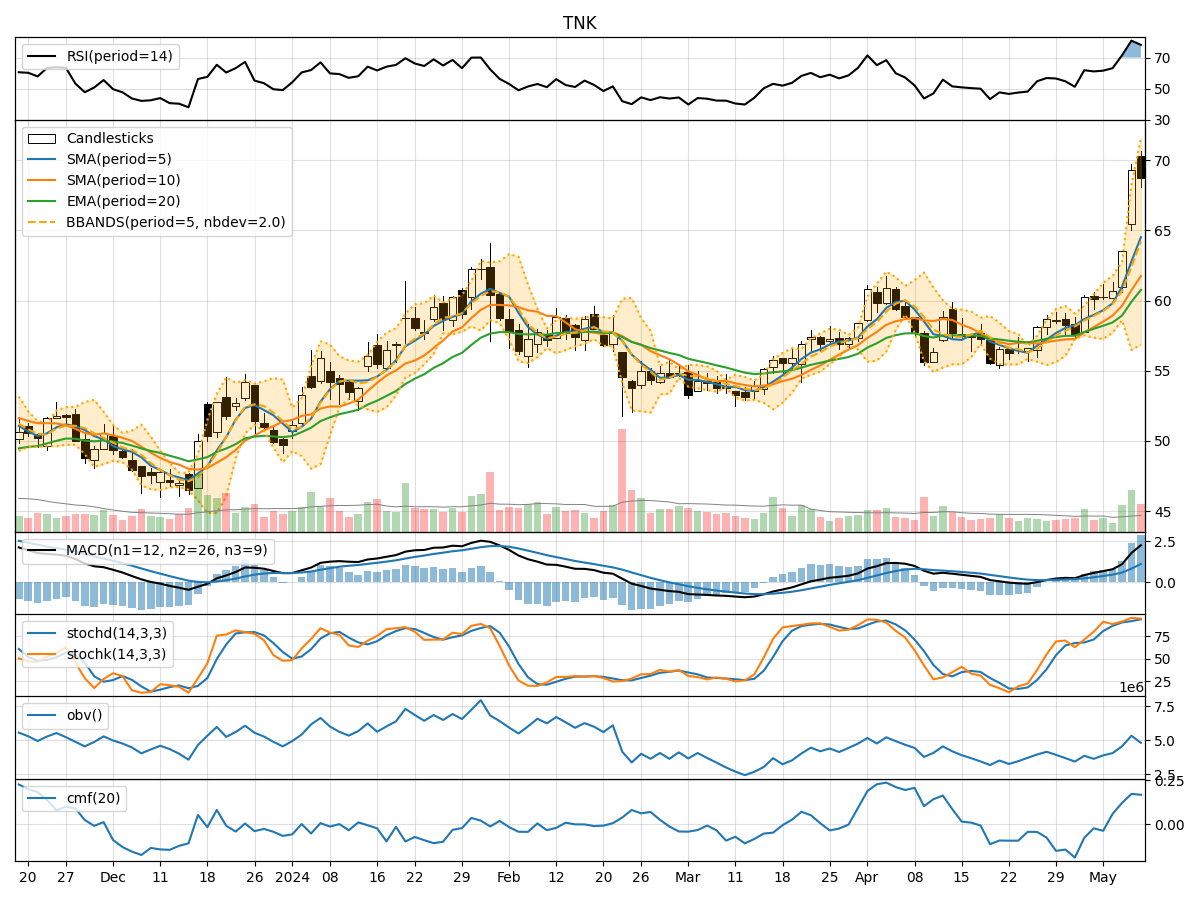
- Moving Averages (MA): The 5-day Moving Average (MA) has been consistently rising, indicating a bullish trend in the short term.
- MACD: The Moving Average Convergence Divergence (MACD) has shown an increasing trend, with the MACD line consistently above the signal line, suggesting strong bullish momentum.
- RSI: The Relative Strength Index (RSI) has been in the overbought territory, indicating a strong bullish sentiment in the market.
Momentum Analysis:
- Stochastic Oscillator: Both %K and %D lines of the Stochastic Oscillator are in the overbought zone, suggesting a potential reversal or consolidation in the near future.
- Williams %R: The Williams %R indicator is also in the oversold region, indicating a possible bearish reversal.
Volatility Analysis:
- Bollinger Bands (BB): The Bollinger Bands have been widening, indicating increased volatility in the stock price.
- BB %B: The %B indicator is below 1, suggesting that the stock price is trading below the lower Bollinger Band, potentially indicating an oversold condition.
Volume Analysis:
- On-Balance Volume (OBV): The OBV has shown mixed signals, with some days experiencing selling pressure and others showing accumulation.
- Chaikin Money Flow (CMF): The CMF has been positive, indicating buying pressure in the market.
Key Observations:
- The trend indicators suggest a strong bullish sentiment in the short term.
- Momentum indicators point towards a potential reversal or consolidation due to overbought conditions.
- Volatility indicators indicate increased price fluctuations, potentially leading to both upside and downside movements.
- Volume indicators show mixed signals, with a slight bias towards buying pressure.
Conclusion:
Based on the analysis of the technical indicators, the next few days' possible stock price movement for TNK is likely to be sideways to slightly bearish in the short term. While the trend remains bullish, the overbought conditions in the momentum indicators and the potential for increased volatility could lead to a period of consolidation or a minor pullback in the stock price. Traders should exercise caution and consider potential entry or exit points based on the evolving market dynamics.