Technical Analysis of TNET 2024-05-10
Overview:
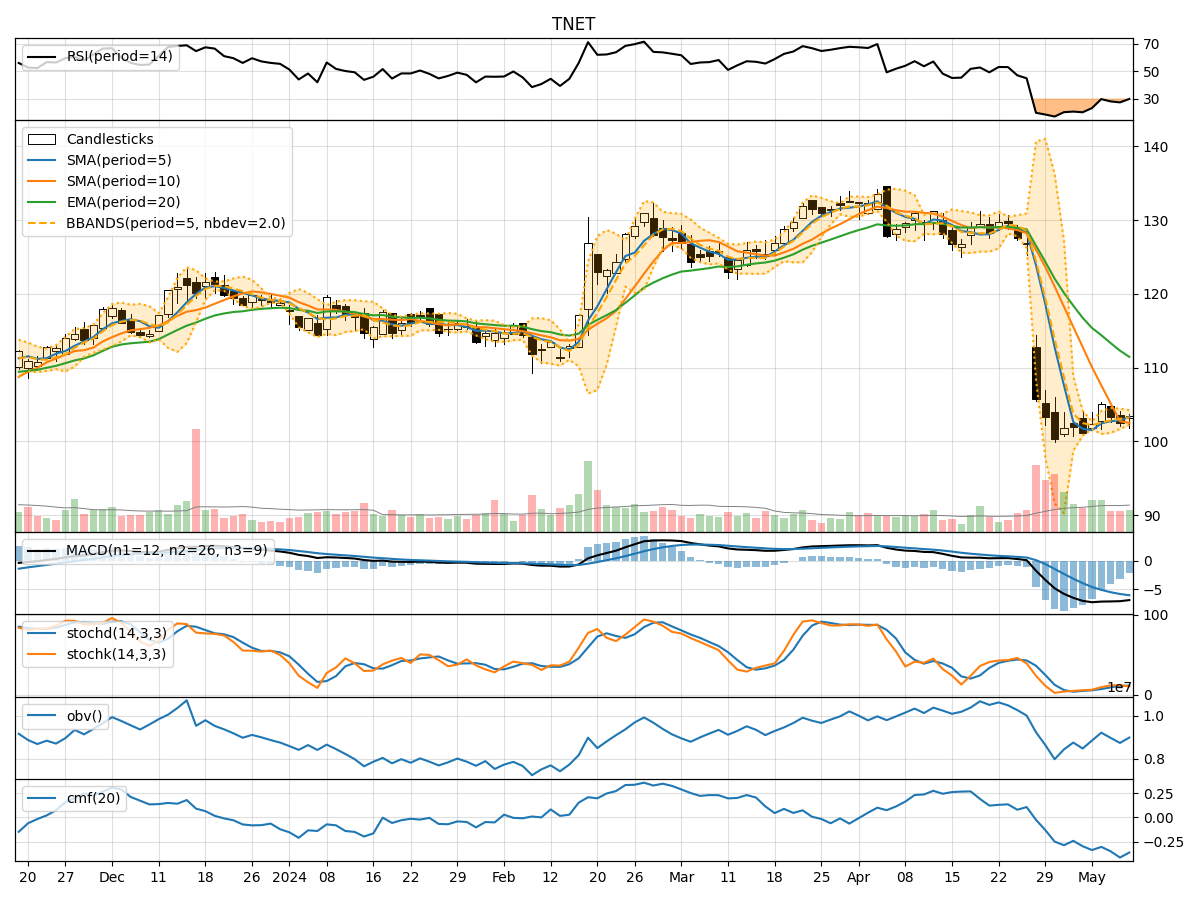
In analyzing the technical indicators for TNET over the last 5 days, we will delve into the trend, momentum, volatility, and volume indicators to provide a comprehensive outlook on the possible stock price movement in the coming days. By examining these key aspects, we aim to offer valuable insights and predictions to guide your investment decisions.
Trend Analysis:
- Moving Averages (MA): The 5-day Moving Average (MA) has been fluctuating around the closing prices, indicating short-term price trends. The Simple Moving Average (SMA) and Exponential Moving Average (EMA) show a downward trend, suggesting a bearish sentiment.
- Moving Average Convergence Divergence (MACD): The MACD and Signal Line have been consistently negative, indicating a bearish trend in momentum.
Momentum Analysis:
- Relative Strength Index (RSI): The RSI values have been relatively low, indicating oversold conditions in the market.
- Stochastic Oscillator: Both %K and %D values have been declining, suggesting weakening momentum.
Volatility Analysis:
- Bollinger Bands (BB): The Bollinger Bands have been narrowing, indicating decreasing volatility in the stock price.
Volume Analysis:
- On-Balance Volume (OBV): The OBV has been fluctuating, indicating indecision among investors.
- Chaikin Money Flow (CMF): The CMF has been negative, suggesting outflow of money from the stock.
Key Observations:
- The trend indicators show a bearish sentiment with declining moving averages and negative MACD.
- Momentum indicators reflect oversold conditions and weakening momentum.
- Volatility has been decreasing, indicating a potential period of consolidation.
- Volume indicators suggest indecision among investors with a negative CMF.
Conclusion:
Based on the analysis of the technical indicators, the outlook for TNET in the next few days is bearish. The stock is likely to experience further downward pressure, possibly leading to a decrease in stock price. Investors should exercise caution and consider waiting for more positive signals before considering any bullish positions.