Technical Analysis of TME 2024-05-10
Overview:
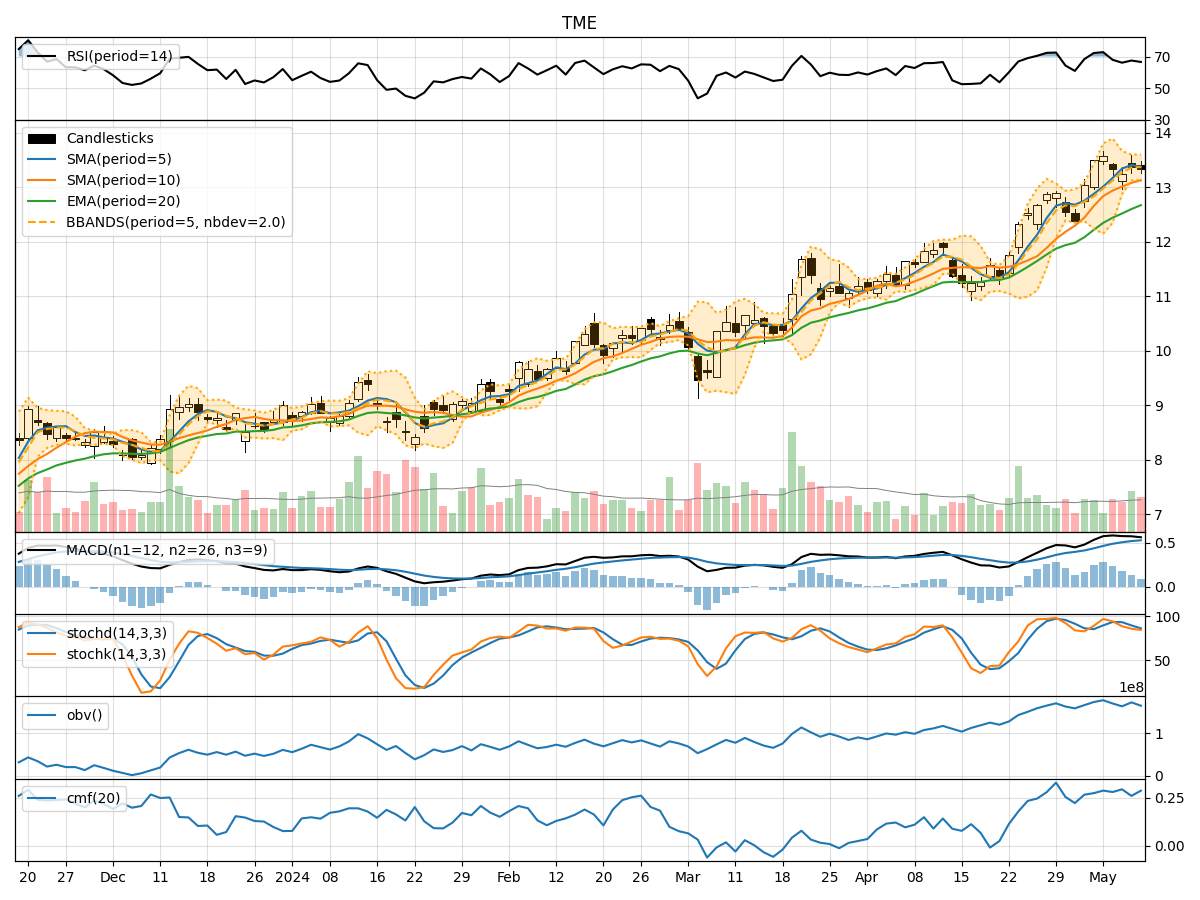
In analyzing the technical indicators for TME over the last 5 days, we will delve into the trend, momentum, volatility, and volume indicators to provide a comprehensive outlook on the possible stock price movement in the coming days.
Trend Analysis:
- Moving Averages (MA): The 5-day Moving Average (MA) has been consistently above the closing prices, indicating an upward trend. Both the Simple Moving Average (SMA) and Exponential Moving Average (EMA) have been trending upwards, suggesting a positive momentum in the stock price.
- MACD: The MACD line has been above the signal line for the past 5 days, with the MACD Histogram also showing an upward trend. This indicates a bullish momentum in the stock.
Momentum Analysis:
- RSI: The Relative Strength Index (RSI) has been fluctuating but generally staying above 50, indicating bullish momentum in the stock.
- Stochastic Oscillator: Both %K and %D lines of the Stochastic Oscillator have been in the overbought zone, suggesting a strong bullish sentiment.
- Williams %R: The Williams %R has been consistently in the oversold territory, indicating a bearish sentiment.
Volatility Analysis:
- Bollinger Bands (BB): The Bollinger Bands have been narrowing, suggesting decreasing volatility in the stock price. The bands are relatively close to each other, indicating a period of consolidation.
- Bollinger %B: The %B indicator has been hovering around 0.5, indicating that the stock is trading at the middle of the bands.
Volume Analysis:
- On-Balance Volume (OBV): The OBV has been fluctuating but generally showing an upward trend, indicating accumulation by investors.
- Chaikin Money Flow (CMF): The CMF has been positive, indicating that money is flowing into the stock.
Conclusion:
Based on the analysis of the technical indicators, the next few days for TME stock price movement are likely to see a continuation of the upward trend. The Moving Averages, MACD, RSI, and OBV all point towards a bullish sentiment in the stock. However, the Williams %R indicator suggests a short-term bearish correction might be possible. The Bollinger Bands indicate a period of consolidation, which could precede a breakout in either direction. Overall, the stock is poised for further upside potential in the coming days, but traders should be cautious of short-term pullbacks.