Technical Analysis of TM 2024-05-10
Overview:
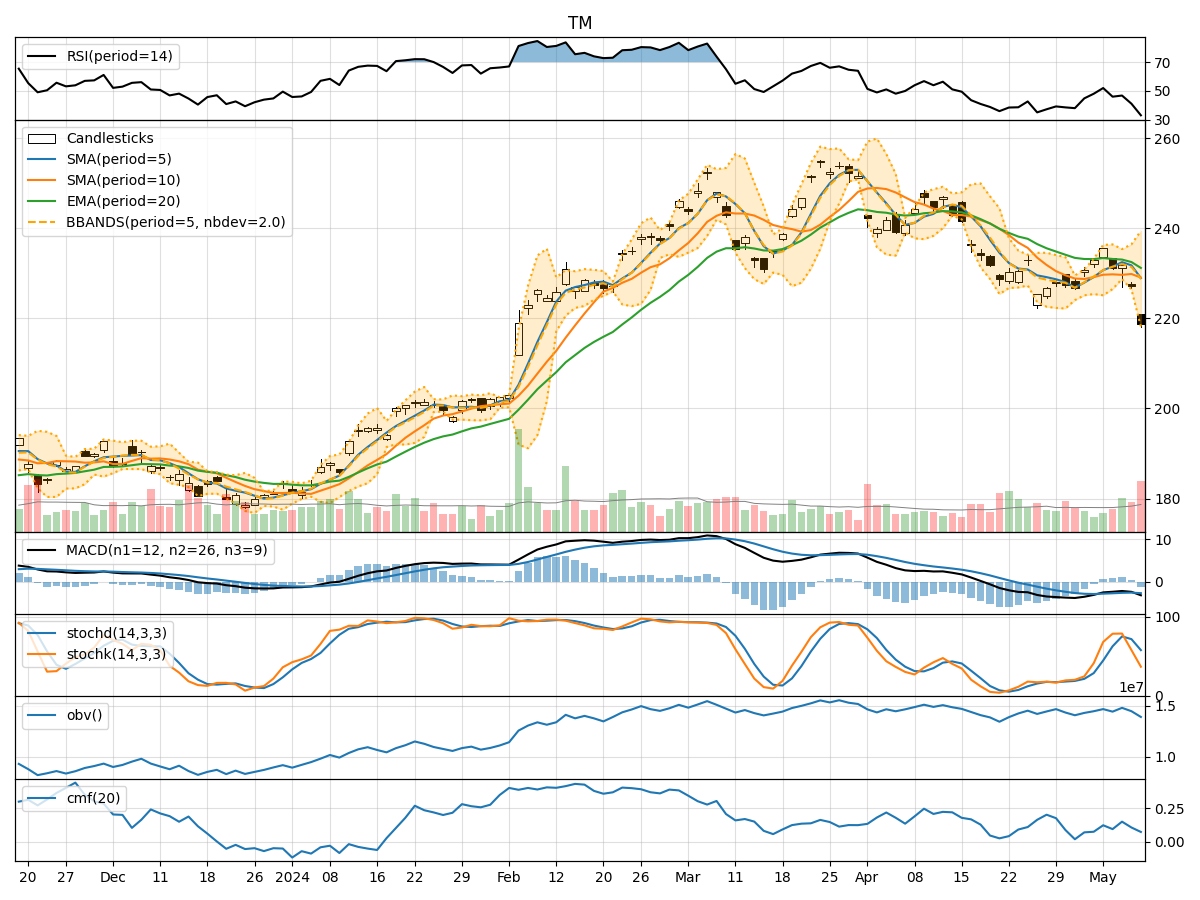
In the last 5 trading days, the stock price of TM has shown a downward trend, with decreasing closing prices and increasing volumes. The trend indicators suggest a bearish sentiment, with moving averages and MACD signaling a potential continuation of the downward movement. Momentum indicators also indicate a bearish momentum, with RSI and stochastic oscillators showing oversold conditions. Volatility indicators suggest a widening of the Bollinger Bands, indicating increased price volatility. Volume indicators show a decrease in On-Balance Volume (OBV) and Chaikin Money Flow (CMF), reflecting a potential decrease in buying pressure.
Trend Indicators:
- Moving Averages (MA): The 5-day MA is below the 10-day SMA, indicating a short-term bearish trend.
- MACD: The MACD line is below the signal line, confirming a bearish trend.
- MACD Histogram: The MACD histogram is negative, indicating a bearish momentum.
Momentum Indicators:
- RSI: The RSI is below 50, indicating bearish momentum.
- Stochastic Oscillators: Both %K and %D are in oversold territory, suggesting a potential reversal.
Volatility Indicators:
- Bollinger Bands (BB): The widening of the Bollinger Bands suggests increasing price volatility.
- Bollinger Band %B (BBP): The %B is below 0.2, indicating the stock is oversold.
Volume Indicators:
- On-Balance Volume (OBV): The OBV has been decreasing, suggesting selling pressure.
- Chaikin Money Flow (CMF): The CMF is below 0, indicating a bearish trend.
Key Observations:
- The stock is currently in a downtrend based on trend and momentum indicators.
- Volatility is increasing, suggesting potential larger price swings.
- Selling pressure is evident from the volume indicators.
Conclusion:
Based on the technical analysis of the indicators, the next few days are likely to see a continuation of the downward movement in the stock price of TM. The bearish trend is supported by multiple indicators showing oversold conditions, bearish momentum, and increasing volatility. Traders and investors should exercise caution and consider shorting or staying out of long positions until there are clear signs of a trend reversal.