Technical Analysis of TK 2024-05-10
Overview:
In analyzing the technical indicators for the stock over the last 5 days, we will delve into the trend, momentum, volatility, and volume indicators to provide a comprehensive assessment of the possible stock price movement in the coming days. By examining these key aspects, we aim to offer valuable insights and predictions to guide your investment decisions.
Trend Analysis:
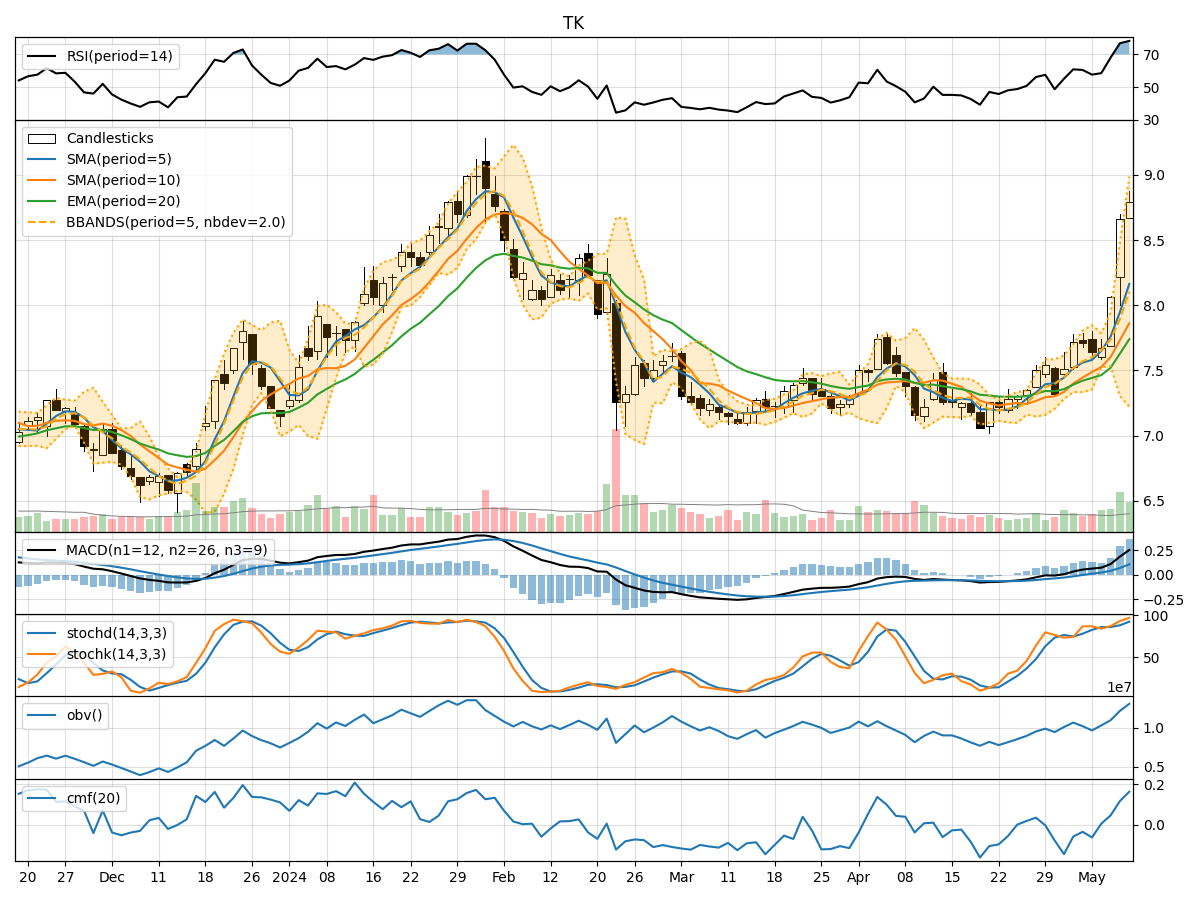
- Moving Averages (MA): The stock's closing prices have been consistently above the 5-day Moving Average, indicating a bullish trend.
- MACD: The MACD line has been consistently above the signal line, suggesting a bullish momentum in the stock price.
- RSI: The Relative Strength Index has been trending upwards, indicating increasing buying pressure.
Key Observation: The trend indicators suggest a strong bullish sentiment in the stock price.
Momentum Analysis:
- Stochastic Oscillator: Both %K and %D values have been consistently high, indicating strong upward momentum.
- Williams %R: The stock has been consistently in the oversold territory, suggesting a potential reversal to the upside.
Key Observation: Momentum indicators confirm the bullish momentum in the stock.
Volatility Analysis:
- Bollinger Bands: The stock price has been consistently trading above the middle Bollinger Band, indicating an uptrend.
- Bollinger %B: The %B value has been above 0.5, indicating an upward momentum in the stock price.
Key Observation: Volatility indicators support the bullish outlook for the stock.
Volume Analysis:
- On-Balance Volume (OBV): The OBV has been steadily increasing, indicating strong buying volume in the stock.
- Chaikin Money Flow (CMF): The CMF has been positive, suggesting that money is flowing into the stock.
Key Observation: Volume indicators signal strong buying interest in the stock.
Conclusion:
Based on the analysis of trend, momentum, volatility, and volume indicators, the stock is likely to continue its upward trajectory in the coming days. The technical indicators collectively point towards a bullish outlook for the stock price. Investors may consider buying or holding positions in the stock to capitalize on the expected price appreciation.
Disclaimer:
Remember that while technical analysis provides valuable insights, it is essential to consider other fundamental factors and market dynamics before making investment decisions. Consult with a financial advisor for personalized guidance tailored to your investment goals and risk tolerance.