Technical Analysis of TIMB 2024-05-10
Overview:
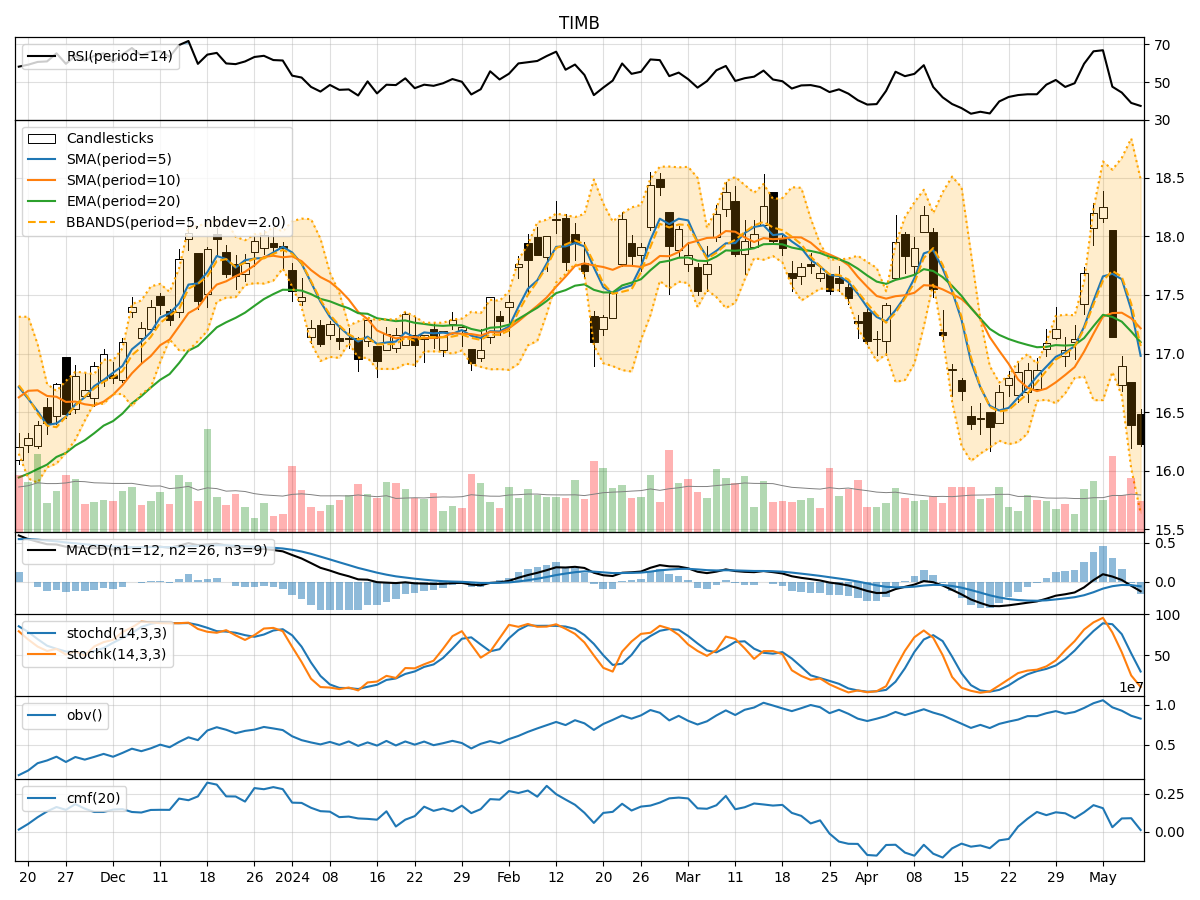
In analyzing the technical indicators for TIMB stock over the last 5 days, we will delve into the trend, momentum, volatility, and volume indicators to provide a comprehensive outlook on the possible stock price movement in the coming days.
Trend Analysis:
- Moving Averages (MA): The 5-day Moving Average (MA) has been declining steadily, indicating a bearish trend in the short term.
- MACD: The MACD line has been consistently below the signal line, suggesting a bearish momentum.
- RSI: The Relative Strength Index (RSI) has been decreasing, reflecting a weakening bullish momentum.
Momentum Analysis:
- Stochastic Oscillator: Both %K and %D have been decreasing, indicating a bearish momentum.
- Williams %R: The indicator has been in oversold territory, signaling a potential reversal or continuation of the downtrend.
Volatility Analysis:
- Bollinger Bands (BB): The stock price has been trading below the lower Bollinger Band, indicating oversold conditions.
- BB Percentage (BBP): The BBP has been increasing, suggesting a potential bounce back towards the middle or upper band.
Volume Analysis:
- On-Balance Volume (OBV): The OBV has been declining, indicating selling pressure in the stock.
- Chaikin Money Flow (CMF): The CMF has been relatively flat, suggesting a neutral stance on the stock.
Key Observations:
- The stock is currently in a downtrend based on moving averages and MACD.
- Momentum indicators like Stochastic Oscillator and Williams %R are signaling oversold conditions.
- Volatility indicators show the stock is oversold but may see a reversal towards the middle Bollinger Band.
- Volume indicators reflect selling pressure with a neutral stance on money flow.
Conclusion:
Based on the technical analysis of the trend, momentum, volatility, and volume indicators, the next few days' possible stock price movement for TIMB is likely to be sideways to slightly bullish as the stock may see a reversal from oversold conditions. However, caution is advised as the overall trend remains bearish, and further confirmation is needed for a sustained upward movement. Traders should closely monitor key support and resistance levels for potential entry or exit points.