Technical Analysis of TGT 2024-05-10
Overview:
In analyzing the technical indicators for TGT over the last 5 days, we will delve into the trend, momentum, volatility, and volume indicators to provide a comprehensive outlook on the possible stock price movement in the coming days. By examining these key aspects, we aim to offer valuable insights and predictions for informed decision-making.
Trend Analysis:
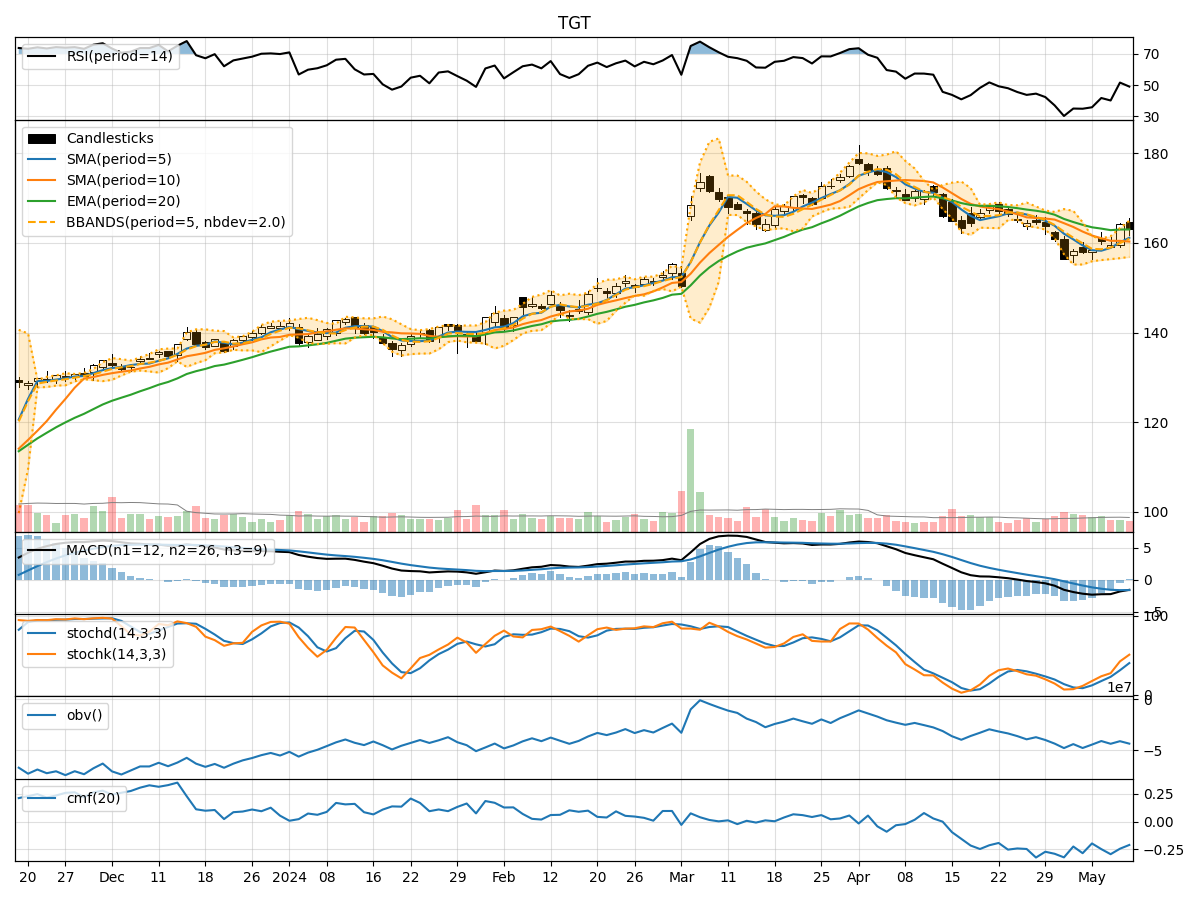
- Moving Averages (MA): The 5-day Moving Average (MA) has been fluctuating around the closing prices, indicating short-term price trends. The Simple Moving Average (SMA) and Exponential Moving Average (EMA) show a downward trend, suggesting a potential bearish sentiment.
- MACD: The Moving Average Convergence Divergence (MACD) has been negative, with the MACD line consistently below the signal line. This indicates a bearish momentum in the stock price.
- Conclusion: The trend indicators suggest a bearish outlook for TGT in the near term.
Momentum Analysis:
- RSI: The Relative Strength Index (RSI) has been below 50, indicating a lack of strong momentum in either direction.
- Stochastic Oscillator: Both %K and %D have been below 50, suggesting a bearish momentum.
- Conclusion: The momentum indicators reflect a neutral to bearish sentiment for TGT.
Volatility Analysis:
- Bollinger Bands (BB): The stock price has been trading within the Bollinger Bands, with the bands narrowing, indicating decreasing volatility.
- Conclusion: Volatility is decreasing, which could lead to a period of consolidation or a potential breakout in the near future.
Volume Analysis:
- On-Balance Volume (OBV): The OBV has been fluctuating, indicating indecision among investors.
- Chaikin Money Flow (CMF): The CMF has been negative, suggesting selling pressure.
- Conclusion: Volume indicators point towards a neutral to bearish sentiment in the market.
Overall Conclusion:
Based on the analysis of trend, momentum, volatility, and volume indicators, the overall outlook for TGT in the next few days is bearish. The trend indicators show a downward trajectory, supported by the negative momentum and volume indicators. The decreasing volatility may lead to a period of consolidation before a potential further downside movement.
Recommendation:
Considering the bearish signals across multiple technical indicators, it is advisable to exercise caution when trading TGT in the coming days. Traders may consider short-term bearish strategies or wait for more clarity in the market direction before taking significant positions. Monitoring key support levels and potential reversal patterns can help in identifying entry and exit points effectively.
Disclaimer:
It is essential to remember that technical analysis is not foolproof and should be used in conjunction with other forms of analysis and risk management strategies. Market conditions can change rapidly, impacting stock prices unpredictably. Always conduct thorough research and consider your risk tolerance before making any investment decisions.