Technical Analysis of TGS 2024-05-10
Overview:
In analyzing the technical indicators for TGS over the last 5 days, we will delve into the trend, momentum, volatility, and volume indicators to provide a comprehensive outlook on the possible stock price movement in the coming days. By examining these key indicators, we aim to offer valuable insights and predictions for informed decision-making.
Trend Analysis:
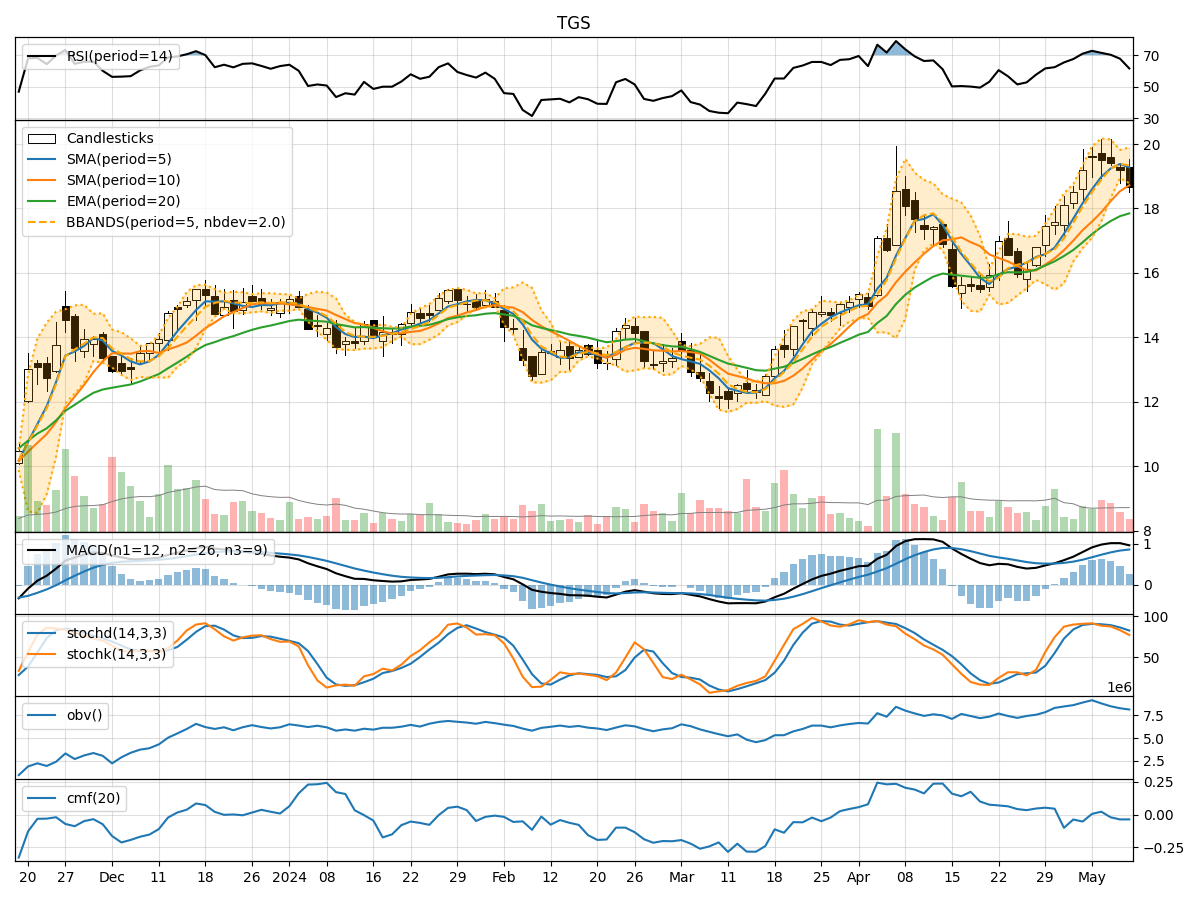
- Moving Averages (MA): The 5-day Moving Average (MA) has been consistently above the Simple Moving Average (SMA) and Exponential Moving Average (EMA), indicating a bullish trend.
- MACD: The MACD line has been above the signal line, with both lines showing an upward trend, suggesting bullish momentum.
- MACD Histogram: The MACD Histogram has been consistently positive, indicating increasing bullish momentum.
Momentum Analysis:
- RSI: The Relative Strength Index (RSI) has been gradually decreasing but remains in the overbought territory, signaling a potential reversal or consolidation.
- Stochastic Oscillator: Both %K and %D have been declining, indicating a bearish momentum.
- Williams %R: The Williams %R is in the oversold region, suggesting a possible reversal or consolidation.
Volatility Analysis:
- Bollinger Bands (BB): The stock price has been trading within the Bollinger Bands, with the bands narrowing, indicating decreasing volatility.
- Bollinger %B: The %B indicator is close to 0, suggesting the stock price is near the lower band, potentially indicating an oversold condition.
Volume Analysis:
- On-Balance Volume (OBV): The OBV has been declining, indicating selling pressure and potential bearish sentiment.
- Chaikin Money Flow (CMF): The CMF has been negative, suggesting outflow of money from the stock.
Conclusion:
Based on the analysis of the technical indicators: - Trend: The stock is in an upward trend based on moving averages and MACD. - Momentum: The momentum indicators suggest a bearish bias with potential for a reversal or consolidation. - Volatility: Volatility is decreasing, indicating a possible period of consolidation. - Volume: The declining OBV and negative CMF point towards bearish sentiment.
Overall View:
Considering the technical indicators collectively, the stock is likely to experience short-term consolidation or a minor pullback in the coming days. Traders should exercise caution and monitor key support and resistance levels for potential entry or exit points. It is advisable to wait for clearer signals before making significant trading decisions.