Technical Analysis of TFX 2024-05-10
Overview:
In analyzing the technical indicators for TFX over the last 5 days, we will delve into the trend, momentum, volatility, and volume indicators to provide a comprehensive assessment of the stock's possible future price movement. By examining these key aspects, we aim to offer valuable insights and predictions for the upcoming trading days.
Trend Analysis:
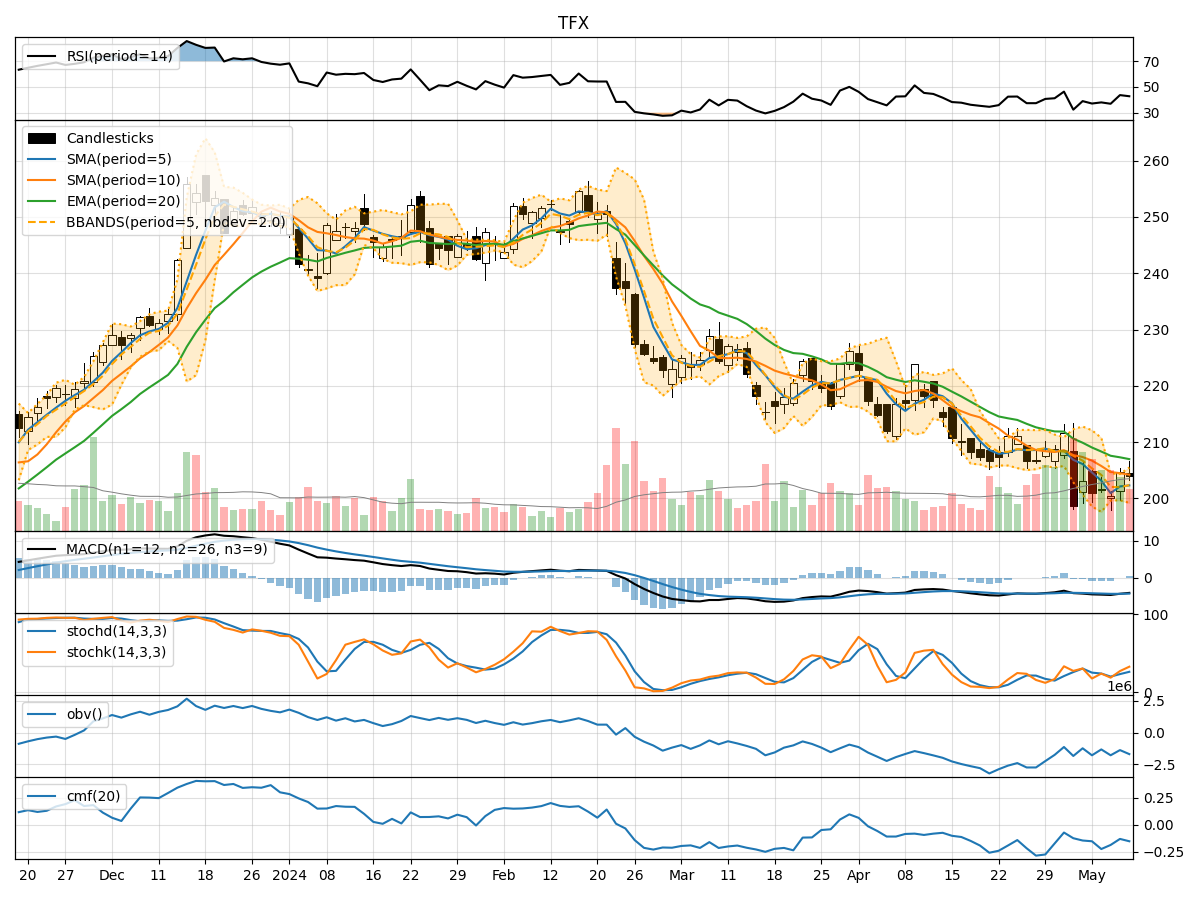
- Moving Averages (MA): The 5-day Moving Average (MA) has been consistently below the Simple Moving Average (SMA) and Exponential Moving Average (EMA) over the past 5 days, indicating a downtrend in the stock price.
- MACD: The Moving Average Convergence Divergence (MACD) has been negative, with the MACD line below the signal line, suggesting bearish momentum in the stock.
Momentum Analysis:
- RSI: The Relative Strength Index (RSI) has been hovering around 40-45, indicating neutral momentum in the stock.
- Stochastic Oscillator: Both %K and %D lines of the Stochastic Oscillator are below 50, suggesting bearish momentum in the stock.
- Williams %R: The Williams %R is in the oversold territory, indicating a potential reversal in the stock price.
Volatility Analysis:
- Bollinger Bands: The stock price has been trading within the Bollinger Bands, with the %B indicator showing values around 0.3-0.9, indicating moderate volatility in the stock.
Volume Analysis:
- On-Balance Volume (OBV): The OBV has been consistently negative over the past 5 days, suggesting selling pressure in the stock.
- Chaikin Money Flow (CMF): The CMF has been negative, indicating outflow of money from the stock.
Key Observations:
- The stock is currently in a downtrend based on moving averages and MACD.
- Momentum indicators suggest bearish sentiment in the stock.
- Volatility is moderate, with the stock trading within the Bollinger Bands.
- Volume indicators point towards selling pressure and an outflow of money from the stock.
Conclusion:
Based on the analysis of the technical indicators, the next few days' possible stock price movement for TFX is likely to be downward or sideways. The stock is currently exhibiting bearish trends and momentum, coupled with selling pressure and negative money flow. Traders and investors should exercise caution and consider waiting for more positive signals before considering long positions.