Technical Analysis of TFII 2024-05-10
Overview:
In analyzing the technical indicators for TFII over the last 5 days, we will delve into the trend, momentum, volatility, and volume indicators to provide a comprehensive outlook on the possible stock price movement in the coming days.
Trend Analysis:
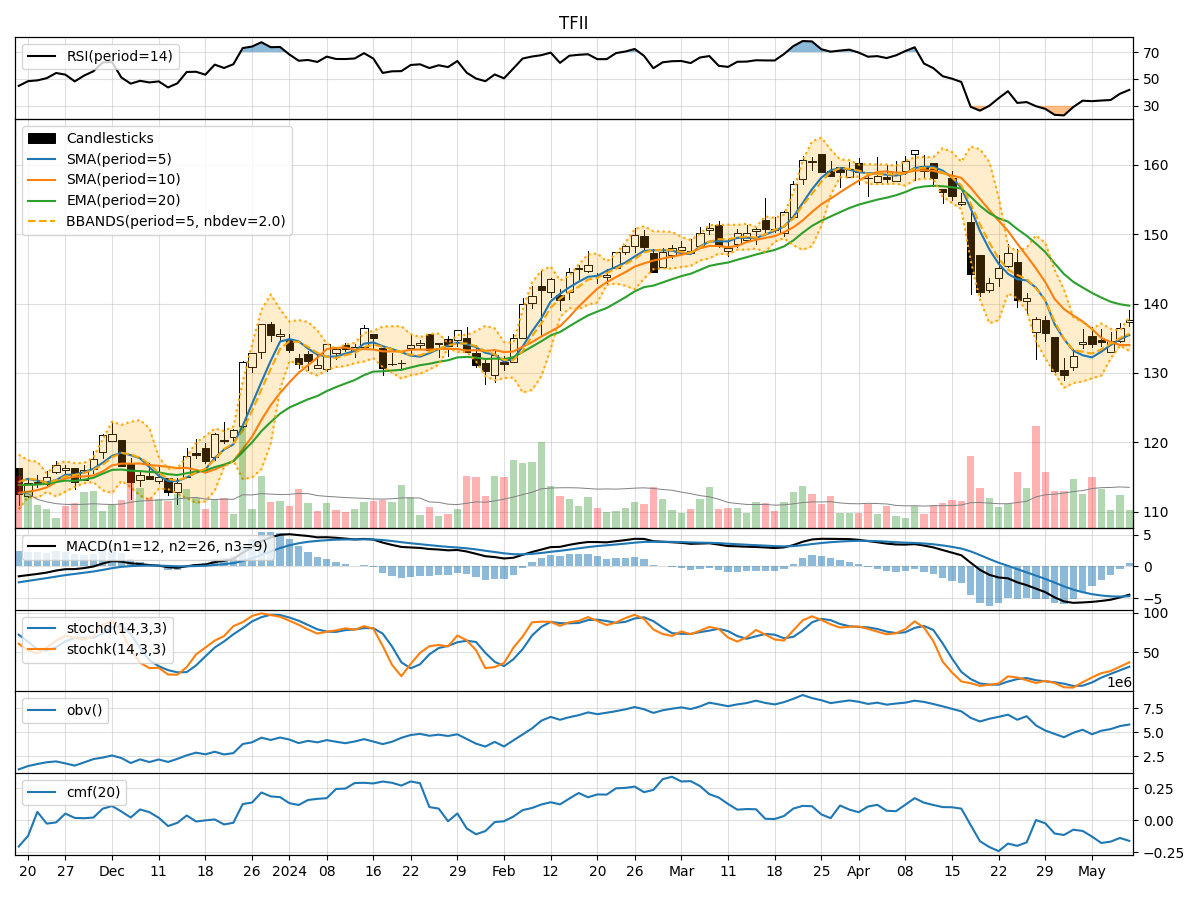
- Moving Averages (MA): The 5-day Moving Average (MA) has been consistently increasing, indicating a bullish trend.
- MACD: The Moving Average Convergence Divergence (MACD) has been negative but showing signs of convergence towards the signal line, suggesting a potential reversal in the bearish momentum.
- EMA: The Exponential Moving Average (EMA) has been declining, indicating a bearish trend.
Momentum Analysis:
- RSI: The Relative Strength Index (RSI) has been gradually increasing, indicating strengthening bullish momentum.
- Stochastic Oscillator: Both %K and %D have been rising, signaling increasing buying pressure.
- Williams %R: The Williams %R is moving towards the oversold region, suggesting a potential buying opportunity.
Volatility Analysis:
- Bollinger Bands (BB): The stock price has been trading within the Bollinger Bands, indicating normal volatility.
- BB Width: The Bollinger Bands width has been relatively stable, suggesting consistent volatility levels.
Volume Analysis:
- On-Balance Volume (OBV): The OBV has been increasing, indicating accumulation by investors.
- Chaikin Money Flow (CMF): The CMF has been negative, suggesting some selling pressure in the stock.
Key Observations:
- The trend indicators show a mix of bullish and bearish signals, with the moving averages conflicting with the MACD and EMA.
- Momentum indicators suggest a strengthening bullish momentum, supported by the RSI and Stochastic Oscillator.
- Volatility remains relatively stable, with the stock price trading within the Bollinger Bands.
- Volume indicators indicate accumulation but with some selling pressure reflected in the CMF.
Conclusion:
Based on the analysis of the technical indicators, the next few days for TFII could see further upward movement in the stock price. The bullish momentum indicated by the RSI and Stochastic Oscillator, along with the increasing OBV, suggests that buyers are active in the market. However, caution is advised due to the conflicting signals in the trend indicators. It is recommended to closely monitor the price action and key support/resistance levels for potential entry or exit points.
Recommendation:
- Short-term: Consider a bullish bias with tight stop-loss levels to manage risk.
- Long-term: Monitor the trend indicators for confirmation of a sustained uptrend before considering long-term positions.
Always remember to conduct further research and consider fundamental factors before making any investment decisions.