Technical Analysis of TFC 2024-05-10
Overview:
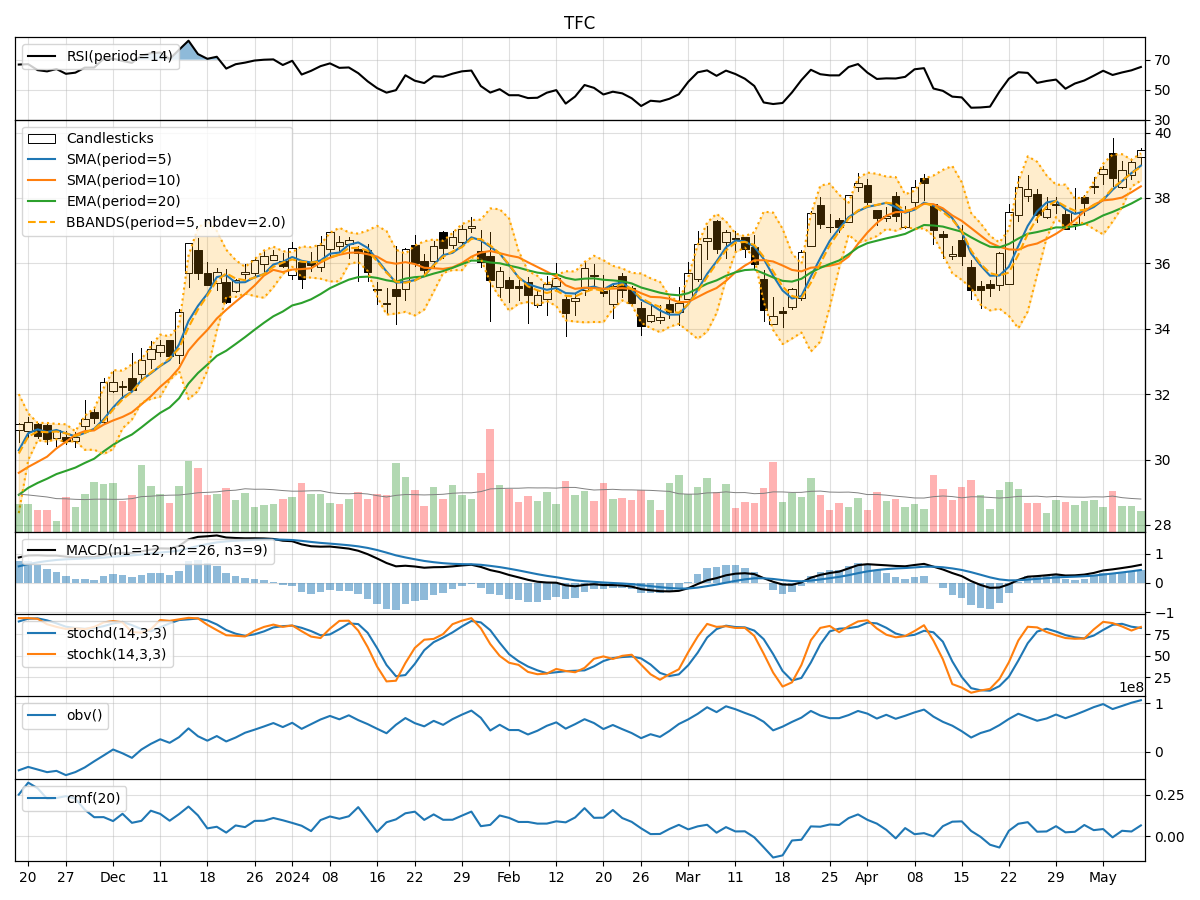
In analyzing the technical indicators for TFC over the last 5 days, we will delve into the trend, momentum, volatility, and volume indicators to provide a comprehensive outlook on the possible stock price movement in the coming days.
Trend Analysis:
- Moving Averages (MA): The 5-day Moving Average (MA) has been consistently rising, indicating a bullish trend in the short term.
- MACD: The MACD line has been increasing, staying above the signal line, suggesting bullish momentum.
- EMA: The Exponential Moving Average has been trending upwards, supporting the bullish sentiment.
Momentum Analysis:
- RSI: The Relative Strength Index (RSI) has been increasing, but it is not in overbought territory yet, indicating potential room for further upside.
- Stochastic Oscillator: Both %K and %D have shown fluctuations but are currently in a range that does not signal extreme overbought conditions.
- Williams %R: The indicator is also not in oversold or overbought territory, suggesting a balanced momentum.
Volatility Analysis:
- Bollinger Bands (BB): The bands have been widening, indicating increased volatility in the stock price.
- BB %B: The %B indicator is above 0.5, suggesting the stock is trading above the middle band.
- BB Width: The widening of the bands may indicate potential price swings in the near future.
Volume Analysis:
- On-Balance Volume (OBV): The OBV has been increasing, indicating accumulation by investors.
- Chaikin Money Flow (CMF): The CMF is positive, suggesting buying pressure in the stock.
Conclusion:
Based on the analysis of the technical indicators, the overall outlook for TFC in the next few days is bullish. The trend indicators, momentum oscillators, and volume indicators all point towards a continuation of the current upward trend. The increasing moving averages, positive MACD, and rising OBV indicate strong buying interest in the stock. While there may be short-term volatility as indicated by the widening Bollinger Bands, the overall momentum remains positive.
Recommendation:
Considering the bullish signals from the technical analysis, investors may look for opportunities to enter long positions in TFC. It is essential to monitor the price action closely and set appropriate stop-loss levels to manage risk. Additionally, keeping an eye on any developments in the broader market and company-specific news can provide further insights into potential price movements.