Technical Analysis of TEL 2024-05-10
Overview:
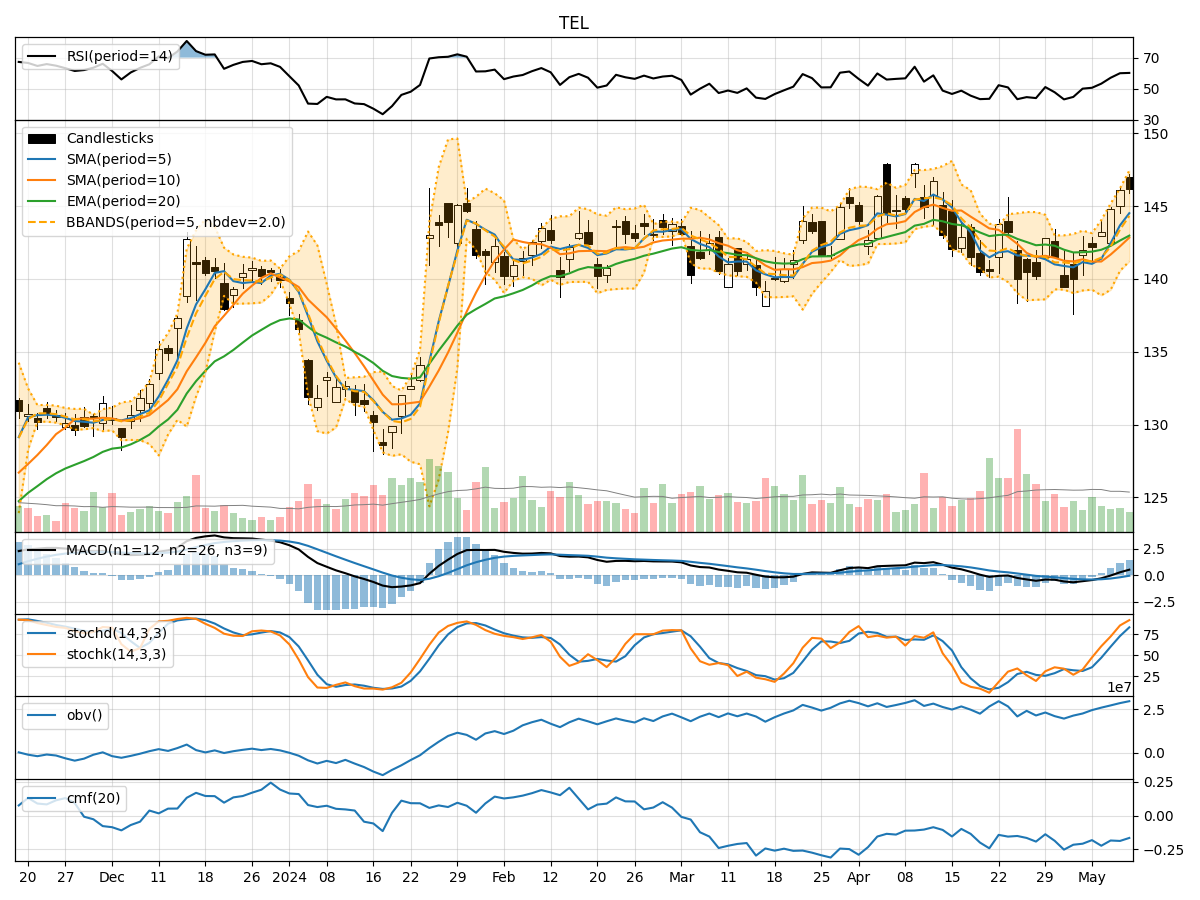
In the last 5 trading days, TEL stock has shown a consistent uptrend in both price and volume. The moving averages have been trending upwards, indicating a bullish sentiment. Momentum indicators like RSI and Stochastic oscillators suggest the stock is in overbought territory but still showing strength. Volatility indicators like Bollinger Bands show an expanding range, while volume indicators like OBV and CMF suggest accumulation.
Trend Analysis:
- Moving Averages (MA): The 5-day MA has been consistently above the 10-day SMA, indicating a short-term bullish trend. The EMA(20) is also trending upwards, supporting the bullish sentiment.
- MACD: The MACD line has been above the signal line for the past few days, indicating positive momentum. The MACD histogram has been increasing, showing strengthening bullish momentum.
Momentum Analysis:
- RSI: The RSI has been increasing and is currently in the overbought zone, suggesting a potential pullback or consolidation in the near term.
- Stochastic Oscillators: Both %K and %D lines are in the overbought zone, indicating a potential reversal or consolidation.
Volatility Analysis:
- Bollinger Bands (BB): The Bollinger Bands have been widening, indicating increasing volatility. The price has been riding the upper band, suggesting a strong uptrend but also a potential for a reversal.
Volume Analysis:
- On-Balance Volume (OBV): The OBV has been steadily increasing, indicating accumulation by investors. This supports the bullish trend.
- Chaikin Money Flow (CMF): The CMF has been negative but improving, suggesting that money flow is turning positive.
Conclusion:
Based on the technical analysis of TEL stock: - Trend: The stock is in a strong uptrend supported by moving averages and MACD. - Momentum: Momentum indicators suggest the stock is overbought, indicating a potential for a pullback or consolidation. - Volatility: Increasing Bollinger Bands width indicates rising volatility, which could lead to a correction or reversal. - Volume: Accumulation shown by OBV supports the bullish trend, while CMF turning positive is a positive sign.
Overall Opinion:
Considering the technical indicators and analysis, the next few days for TEL stock could see a potential pullback or consolidation due to overbought conditions and increasing volatility. Investors should be cautious and consider taking profits or waiting for a better entry point. The long-term trend remains bullish, but short-term caution is advised.