Technical Analysis of TEF 2024-05-10
Overview:
In analyzing the technical indicators for TEF over the last 5 days, we will delve into the trend, momentum, volatility, and volume indicators to provide a comprehensive outlook on the possible stock price movement in the coming days. By examining these key aspects, we aim to offer valuable insights and predictions to guide your investment decisions.
Trend Analysis:
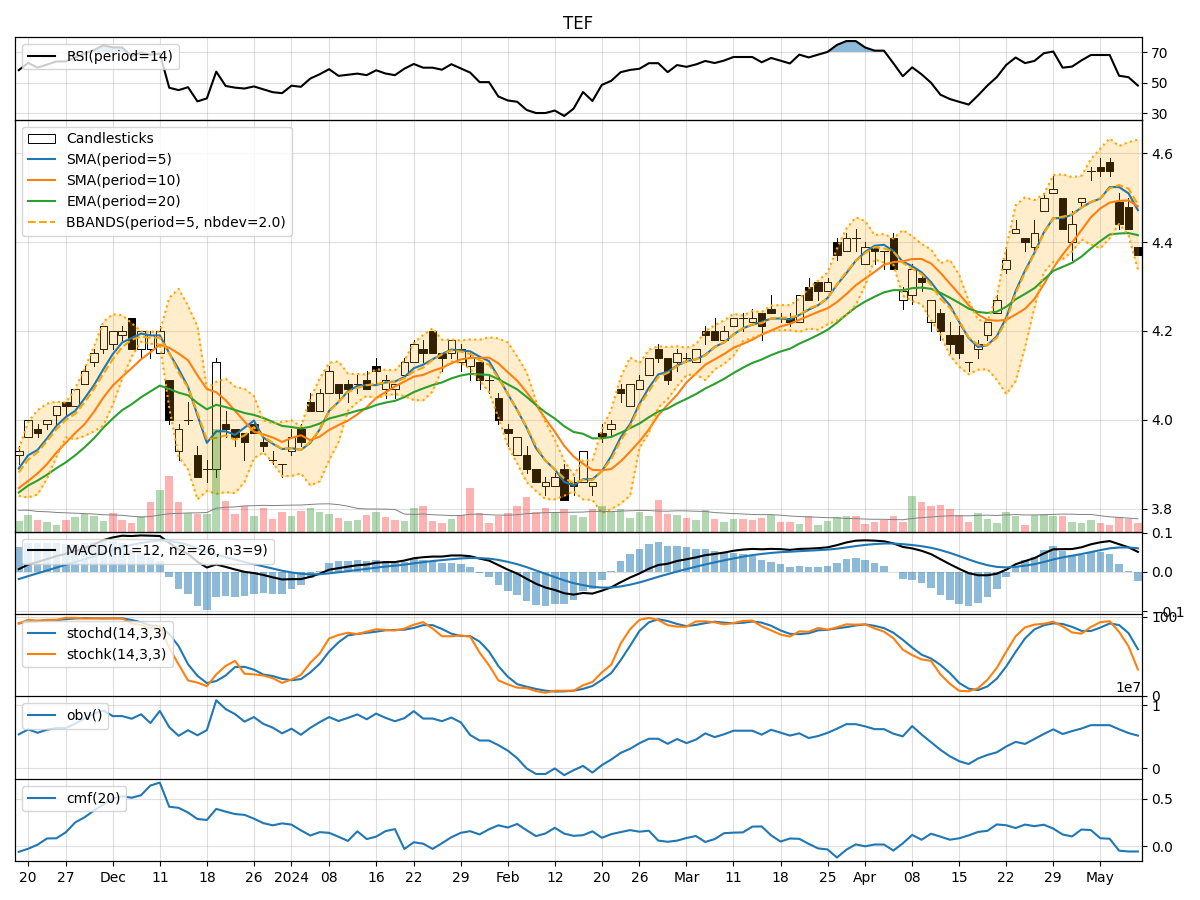
- Moving Averages (MA): The 5-day Moving Average (MA) has been fluctuating around the current price, indicating a lack of clear trend direction.
- MACD: The Moving Average Convergence Divergence (MACD) has shown positive values, suggesting a bullish momentum in the short term.
- EMA: The Exponential Moving Average (EMA) has been gradually increasing, indicating a potential bullish trend.
Key Observation: The trend indicators suggest a slightly bullish sentiment in the short term.
Momentum Analysis:
- RSI: The Relative Strength Index (RSI) has been fluctuating around the neutral zone, indicating indecision in the market.
- Stochastic Oscillator: The Stochastic Oscillator shows a mix of overbought and oversold conditions, reflecting a lack of clear momentum direction.
- Williams %R: The Williams %R is in the oversold territory, signaling a potential reversal in the short term.
Key Observation: The momentum indicators suggest a neutral to slightly bearish sentiment in the short term.
Volatility Analysis:
- Bollinger Bands (BB): The Bollinger Bands have shown narrowing bands, indicating decreasing volatility.
- Bollinger %B: The %B indicator is hovering around the middle range, suggesting a balanced market sentiment.
Key Observation: The volatility indicators suggest a decrease in volatility and a potential period of consolidation.
Volume Analysis:
- On-Balance Volume (OBV): The OBV has been declining, indicating selling pressure in the market.
- Chaikin Money Flow (CMF): The CMF is negative, suggesting a lack of buying interest in the stock.
Key Observation: The volume indicators suggest a bearish sentiment with more selling pressure.
Conclusion:
Based on the analysis of the technical indicators, the overall outlook for TEF in the next few days leans towards a sideways to slightly bearish movement. The trend indicators show a potential bullish bias, while momentum and volume indicators point towards a neutral to bearish sentiment. The decrease in volatility suggests a period of consolidation. It is advisable to closely monitor the price action and key support levels for potential entry or exit points.
Key Recommendations:
- Monitor Price Action: Keep a close eye on how the stock price reacts to key support and resistance levels.
- Risk Management: Implement proper risk management strategies to protect your investment in case of unexpected price movements.
- Wait for Confirmation: Consider waiting for clearer signals or confirmation of a trend before making significant trading decisions.
By combining these technical insights with fundamental analysis and market dynamics, you can make well-informed decisions in navigating the stock market effectively.