Technical Analysis of TDG 2024-05-10
Overview:
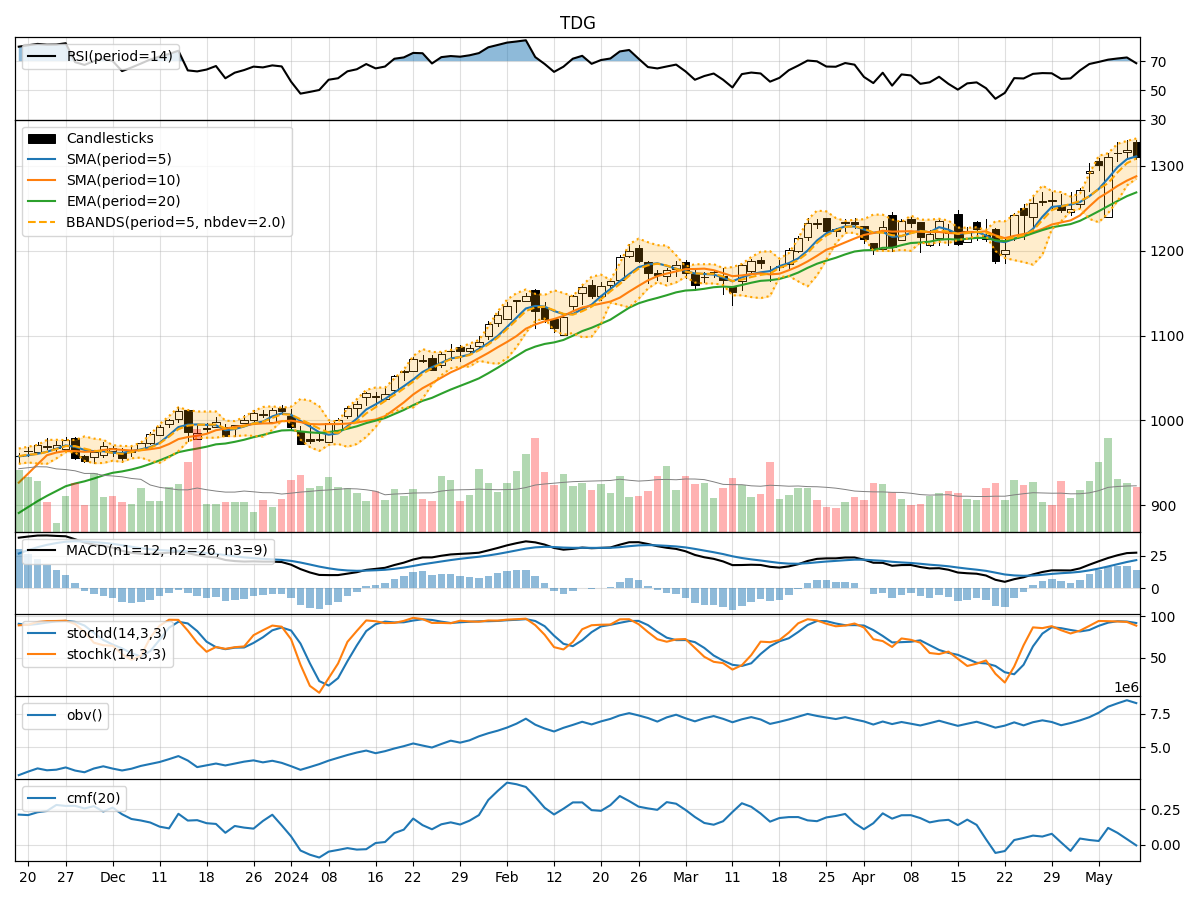
In analyzing the technical indicators for TDG over the last 5 days, we will delve into the trend, momentum, volatility, and volume indicators to provide a comprehensive outlook on the possible stock price movement in the coming days.
Trend Indicators:
- Moving Averages (MA): The 5-day MA has been consistently above the 10-day SMA, indicating a short-term bullish trend. The EMA(20) has been steadily increasing, reflecting positive momentum.
- MACD: The MACD line has been above the signal line, suggesting bullish momentum. The MACD histogram has been increasing, indicating strengthening bullish momentum.
Momentum Indicators:
- RSI: The RSI has been in the overbought territory, indicating a strong bullish momentum.
- Stochastic Oscillator: Both %K and %D have been in the overbought zone, signaling a strong bullish sentiment.
- Williams %R: The indicator has been in the oversold region, suggesting a potential reversal to the upside.
Volatility Indicators:
- Bollinger Bands: The stock price has been trading within the bands, with the %B indicator hovering around the midline. This suggests a period of consolidation.
- Average True Range (ATR): The ATR has been relatively stable, indicating consistent volatility levels.
Volume Indicators:
- On-Balance Volume (OBV): The OBV has been increasing, reflecting accumulation by investors.
- Chaikin Money Flow (CMF): The CMF has been positive, indicating buying pressure in the stock.
Key Observations:
- The trend indicators show a strong bullish sentiment with moving averages and MACD signaling upward momentum.
- Momentum indicators suggest an overbought condition, indicating a potential pullback or consolidation.
- Volatility indicators point towards a period of consolidation with stable volatility levels.
- Volume indicators reflect increasing buying pressure and accumulation by investors.
Conclusion:
Based on the analysis of the technical indicators, the stock is likely to experience a short-term pullback or consolidation due to the overbought conditions indicated by the momentum indicators. However, the overall trend remains bullish, supported by the positive trend indicators and volume accumulation. Traders may consider taking profits or waiting for a better entry point during the consolidation phase. Long-term investors can hold their positions with a bullish outlook.