Technical Analysis of TD 2024-05-10
Overview:
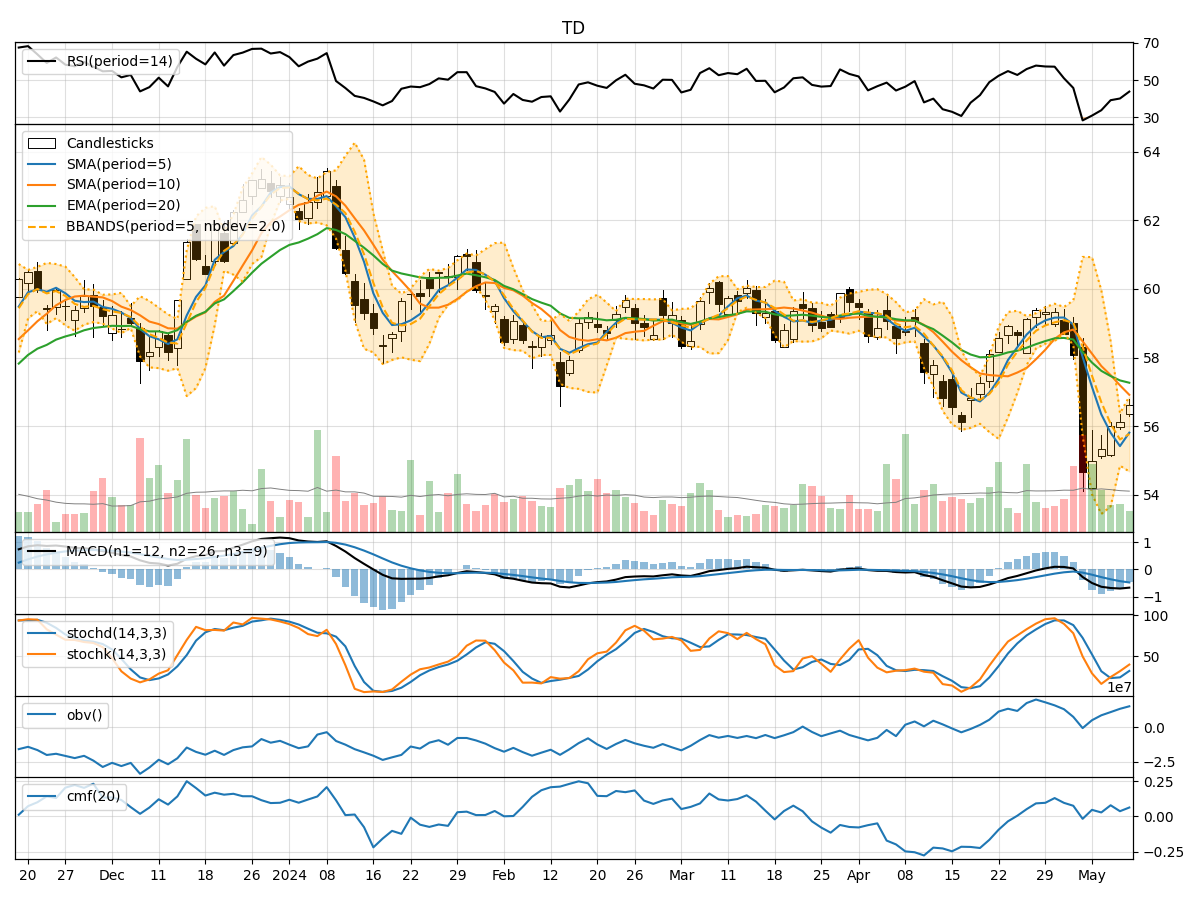
In analyzing the provided Technical Analysis (TA) data for the last 5 days, we will delve into the trend, momentum, volatility, and volume indicators to forecast the possible stock price movement for the next few days. By examining these key indicators, we aim to provide a comprehensive and insightful analysis to guide your decision-making process.
Trend Indicators:
- Moving Averages (MA): The 5-day MA has been consistently below the closing prices, indicating a short-term downtrend.
- MACD: The MACD line has been below the signal line for the past 5 days, suggesting a bearish momentum.
- EMA: The EMA has been declining, further supporting the bearish trend.
Momentum Indicators:
- RSI: The RSI has been below 50 for the entire period, signifying a bearish momentum.
- Stochastic Oscillator: Both %K and %D have been below 50, indicating a bearish sentiment.
- Williams %R: The indicator has been in oversold territory, suggesting a potential reversal.
Volatility Indicators:
- Bollinger Bands (BB): The stock price has consistently traded below the lower Bollinger Band, indicating oversold conditions.
- Bollinger Band Width: The band width has been widening, suggesting increased volatility.
- Bollinger Band %B: The %B indicator has been below 1, indicating a potential bounce back.
Volume Indicators:
- On-Balance Volume (OBV): The OBV has been increasing, suggesting accumulation by investors.
- Chaikin Money Flow (CMF): The CMF has been positive, indicating buying pressure in the market.
Key Observations and Opinions:
- Trend: The trend indicators point towards a bearish sentiment with prices consistently below moving averages and declining MACD and EMA.
- Momentum: Momentum indicators confirm the bearish outlook with RSI below 50 and stochastic oscillators signaling oversold conditions.
- Volatility: Volatility indicators suggest increased volatility with the potential for a bounce back as the price has been trading below the lower Bollinger Band.
- Volume: Volume indicators show accumulation by investors as OBV has been increasing, supported by a positive CMF.
Conclusion:
Based on the analysis of the technical indicators, the next few days are likely to see a continuation of the bearish trend in the stock price. Investors should exercise caution and consider potential reversal signals such as the Williams %R indicator moving out of oversold territory. It is advisable to closely monitor the price action and key support levels for any signs of a trend reversal.