Technical Analysis of TCOA 2024-05-31
Overview:
In analyzing the technical indicators for TCOA over the last 5 days, we will delve into the trend, momentum, volatility, and volume indicators to provide a comprehensive outlook on the possible stock price movement in the coming days. By examining these key aspects, we aim to offer valuable insights and recommendations for potential investors.
Trend Analysis:
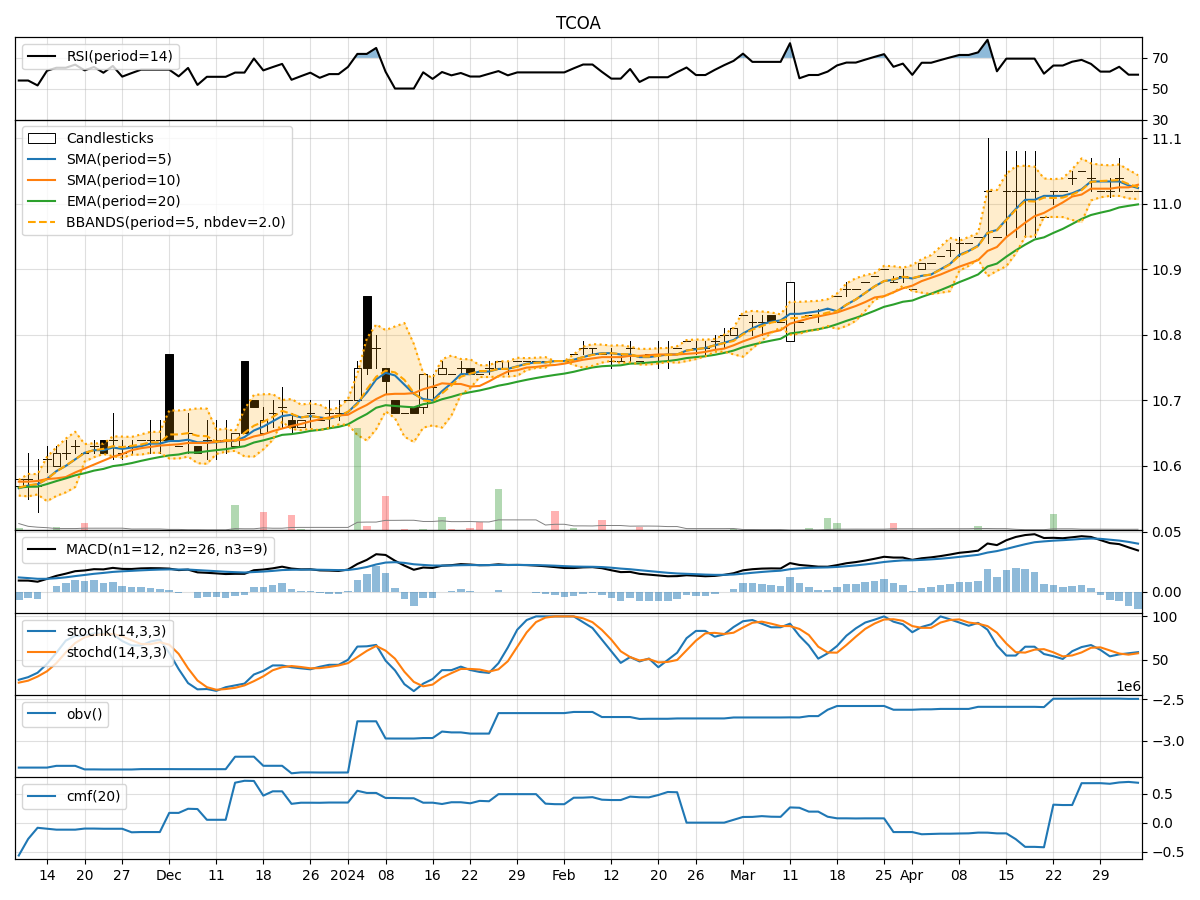
- Moving Averages (MA): The 5-day MA has been relatively stable around the closing price, indicating a lack of significant trend direction.
- MACD and Signal Line: The MACD has been decreasing slightly, suggesting a potential weakening of bullish momentum.
- Relative Strength Index (RSI): The RSI has been hovering around the mid-level, indicating a neutral stance in terms of momentum.
Momentum Analysis:
- Stochastic Oscillator: Both %K and %D have been declining, signaling a potential bearish momentum.
- Williams %R (Willr): The indicator has been consistently in oversold territory, indicating a potential reversal or continuation of the downtrend.
Volatility Analysis:
- Bollinger Bands (BB): The bands have been relatively narrow, suggesting low volatility in the stock price.
- Bollinger Band %B (BBP): The %B has been fluctuating around 0.5, indicating a balanced state between upper and lower bands.
Volume Analysis:
- On-Balance Volume (OBV): The OBV has remained constant, indicating a lack of significant volume accumulation or distribution.
- Chaikin Money Flow (CMF): The CMF has been negative, suggesting a bearish pressure on the stock.
Key Observations:
- The stock is currently exhibiting a lack of clear trend direction, with indicators pointing towards a neutral to slightly bearish sentiment.
- Momentum indicators are showing signs of weakening bullish momentum and a potential shift towards bearish territory.
- Volatility remains low, indicating a stable price movement environment.
- Volume indicators suggest a lack of significant buying or selling pressure in the stock.
Conclusion:
Based on the analysis of the technical indicators, the next few days' possible stock price movement for TCOA is likely to be sideways with a slight bearish bias. Investors should exercise caution and closely monitor key support and resistance levels for potential entry or exit points. It is advisable to wait for clearer signals of a trend reversal or confirmation before making any significant trading decisions.