Technical Analysis of TCN 2024-04-26
Overview:
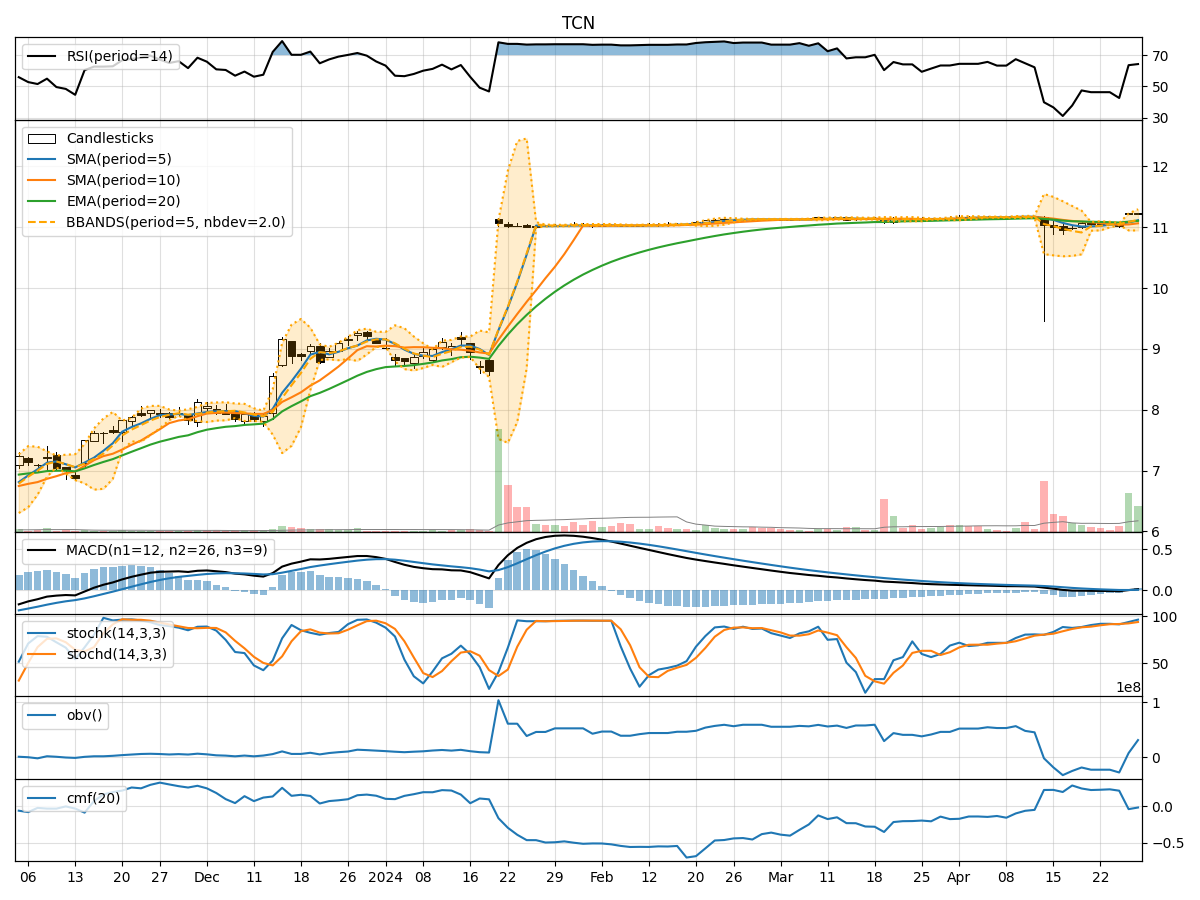
In analyzing the technical indicators for TCN over the last 5 days, we will delve into the trend, momentum, volatility, and volume indicators to provide a comprehensive outlook on the possible stock price movement in the coming days. By examining these key indicators, we aim to offer valuable insights and recommendations for potential investors.
Trend Indicators:
- Moving Averages (MA): The 5-day MA has been fluctuating around the closing prices, indicating a lack of clear trend direction.
- MACD: The MACD line has been hovering around the signal line, suggesting a neutral stance in terms of momentum.
- EMA: The EMA has shown slight fluctuations but has not provided a strong indication of a clear trend.
Key Observation: The trend indicators do not show a strong directional bias, signaling a period of consolidation or sideways movement.
Momentum Indicators:
- RSI: The RSI values have been moderate, indicating neither overbought nor oversold conditions.
- Stochastic Oscillator: Both %K and %D values have been relatively high, suggesting bullish momentum.
- Williams %R: The Williams %R values have been close to oversold territory, indicating a potential reversal.
Key Observation: Momentum indicators suggest a mixed outlook with a slight bullish bias.
Volatility Indicators:
- Bollinger Bands (BB): The stock price has been trading within the bands, indicating normal volatility.
- BB Width: The width of the bands has been relatively stable, suggesting consistent volatility levels.
- BB %B: The %B values have not shown extreme readings, indicating a balanced volatility environment.
Key Observation: Volatility indicators point towards a stable and controlled volatility environment.
Volume Indicators:
- On-Balance Volume (OBV): The OBV values have been fluctuating, indicating mixed buying and selling pressure.
- Chaikin Money Flow (CMF): The CMF values have been positive but declining, signaling a potential decrease in buying pressure.
Key Observation: Volume indicators suggest a lack of strong conviction from market participants.
Conclusion:
Based on the analysis of the technical indicators, the next few days for TCN are likely to see sideways movement with a slight bullish bias. The lack of clear trend direction, mixed momentum signals, stable volatility, and fluctuating volume indicate a period of consolidation. Investors should exercise caution and closely monitor key levels for potential breakout or breakdown scenarios.