Technical Analysis of TARO 2024-05-10
Overview:
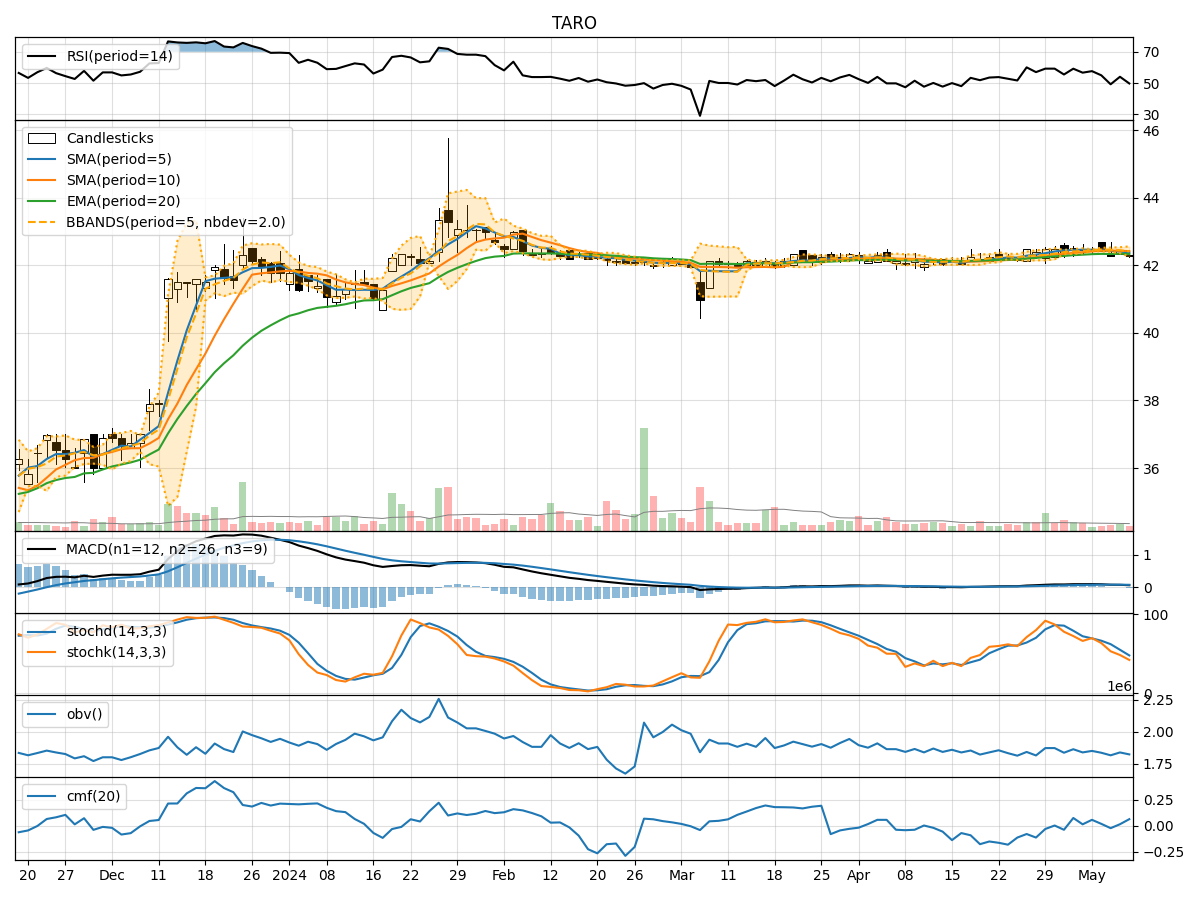
In analyzing the technical indicators for TARO over the last 5 days, we will delve into the trend, momentum, volatility, and volume indicators to provide a comprehensive outlook on the possible stock price movement. By examining these key aspects, we aim to offer valuable insights and predictions for the upcoming days.
Trend Indicators:
- Moving Averages (MA): The 5-day MA has been fluctuating around the closing prices, indicating a relatively stable trend.
- MACD: The MACD line has shown slight positive movements, but the MACD histogram has been mostly negative, suggesting a potential weakening trend.
- EMA: The EMA has been relatively flat, reflecting a lack of strong directional bias.
Momentum Indicators:
- RSI: The RSI values have been oscillating around the mid-level, indicating a neutral momentum.
- Stochastic Oscillator: Both %K and %D have been declining, signaling a potential bearish momentum.
- Williams %R: The indicator has been in oversold territory, suggesting a possible reversal in momentum.
Volatility Indicators:
- Bollinger Bands (BB): The bands have been narrowing, indicating decreasing volatility.
- BB %B: The %B values have been hovering around the middle band, reflecting a balanced volatility level.
Volume Indicators:
- On-Balance Volume (OBV): The OBV has shown mixed movements, suggesting indecision among market participants.
- Chaikin Money Flow (CMF): The CMF has been relatively flat, indicating a neutral volume trend.
Key Observations:
- The trend indicators show a lack of clear direction, with mixed signals from the moving averages and MACD.
- Momentum indicators suggest a potential shift towards bearish sentiment, as seen in the declining stochastic values.
- Volatility has been decreasing, indicating a possible period of consolidation or range-bound trading.
- Volume indicators reflect indecision among traders, with no strong accumulation or distribution signals.
Conclusion:
Based on the analysis of the technical indicators, the stock price of TARO is likely to experience sideways movement in the next few days. The lack of strong trends, coupled with mixed momentum and volume signals, suggests a period of consolidation. Traders should exercise caution and wait for clearer signals before making significant trading decisions.